OPEN-SOURCE SCRIPT
已更新 Beyond Insights Indicator
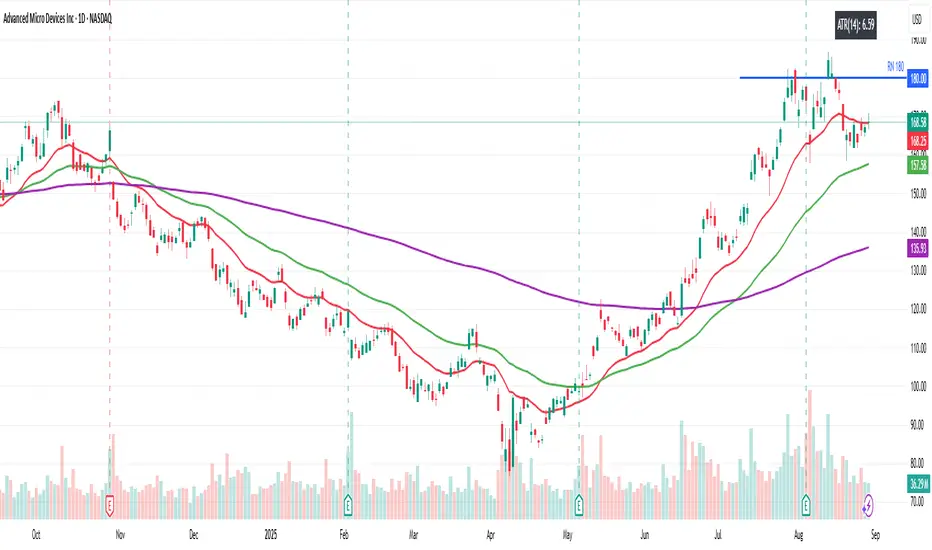
The Beyond Insights Indicator is a multi-timeframe overlay tool designed for TradingView that displays key Exponential Moving Averages (EMAs) and volatility insights to support various trading strategies. It intelligently adapts its display based on the current chart timeframe to reduce clutter and enhance relevance. Specifically, it shows EMA 6, 18, and 50 when viewing intraday timeframes.
In addition to EMAs, the indicator includes an ATR (Average True Range) calculation with a default length of 14, offering insight into market volatility.
In addition to EMAs, the indicator includes an ATR (Average True Range) calculation with a default length of 14, offering insight into market volatility.
版本注释
Purpose of the Script:When you switch between Monthly/Weekly/Daily charts, you only see the corresponding EMA20/50/200 lines (styled slightly differently to indicate the timeframe).
When you drop to any intraday chart (1 min, 5 min, 1 hour…), you instead see faster EMAs (6, 18, 50) suited to that shorter timeframe.
No matter which timeframe you’re on, there’s always a small overlay table in the top-right showing the current 14-period ATR reading.
The ATR reading in the corner gives you an immediate sense of current volatility without opening a separate indicator pane.
版本注释
Updated ATR to Two Decimal.Make the ATR more visible (Shifted to left)
开源脚本
秉承TradingView的精神,该脚本的作者将其开源,以便交易者可以查看和验证其功能。向作者致敬!您可以免费使用该脚本,但请记住,重新发布代码须遵守我们的网站规则。
免责声明
这些信息和出版物并非旨在提供,也不构成TradingView提供或认可的任何形式的财务、投资、交易或其他类型的建议或推荐。请阅读使用条款了解更多信息。
免责声明
这些信息和出版物并非旨在提供,也不构成TradingView提供或认可的任何形式的财务、投资、交易或其他类型的建议或推荐。请阅读使用条款了解更多信息。