OPEN-SOURCE SCRIPT
已更新 Average Yield Inversion
Description:
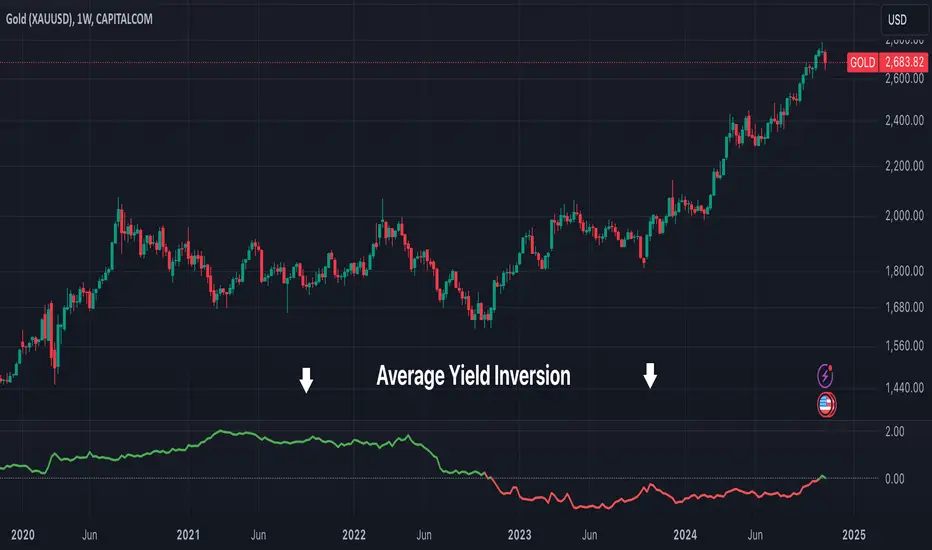
This script calculates and visualizes the average yield curve spread to identify whether the yield curve is inverted or normal. It takes into account short-term yields (1M, 3M, 6M, 2Y) and long-term yields (10Y, 30Y).
Key Features:
This tool is perfect for investors, analysts, and economists who need to monitor yield curve dynamics at a glance.
This script calculates and visualizes the average yield curve spread to identify whether the yield curve is inverted or normal. It takes into account short-term yields (1M, 3M, 6M, 2Y) and long-term yields (10Y, 30Y).
- Positive values: The curve is normal, indicating long-term yields are higher than short-term yields. This often reflects economic growth expectations.
- Negative values: The curve is inverted, meaning short-term yields are higher than long-term yields, a potential signal of economic slowdown or recession.
Key Features:
- Calculates the average spread between long-term and short-term yields.
- Displays a clear graph with a zero-line reference for quick interpretation.
- Useful for tracking macroeconomic trends and potential market turning points.
This tool is perfect for investors, analysts, and economists who need to monitor yield curve dynamics at a glance.
版本注释
Added red color for inversion and green for non inversion版本注释
Update: removed Chart to show the indicator only版本注释
Update: added symbol and chart for comparison版本注释
Update: added title开源脚本
秉承TradingView的精神,该脚本的作者将其开源,以便交易者可以查看和验证其功能。向作者致敬!您可以免费使用该脚本,但请记住,重新发布代码须遵守我们的网站规则。
免责声明
这些信息和出版物并非旨在提供,也不构成TradingView提供或认可的任何形式的财务、投资、交易或其他类型的建议或推荐。请阅读使用条款了解更多信息。
开源脚本
秉承TradingView的精神,该脚本的作者将其开源,以便交易者可以查看和验证其功能。向作者致敬!您可以免费使用该脚本,但请记住,重新发布代码须遵守我们的网站规则。
免责声明
这些信息和出版物并非旨在提供,也不构成TradingView提供或认可的任何形式的财务、投资、交易或其他类型的建议或推荐。请阅读使用条款了解更多信息。