OPEN-SOURCE SCRIPT
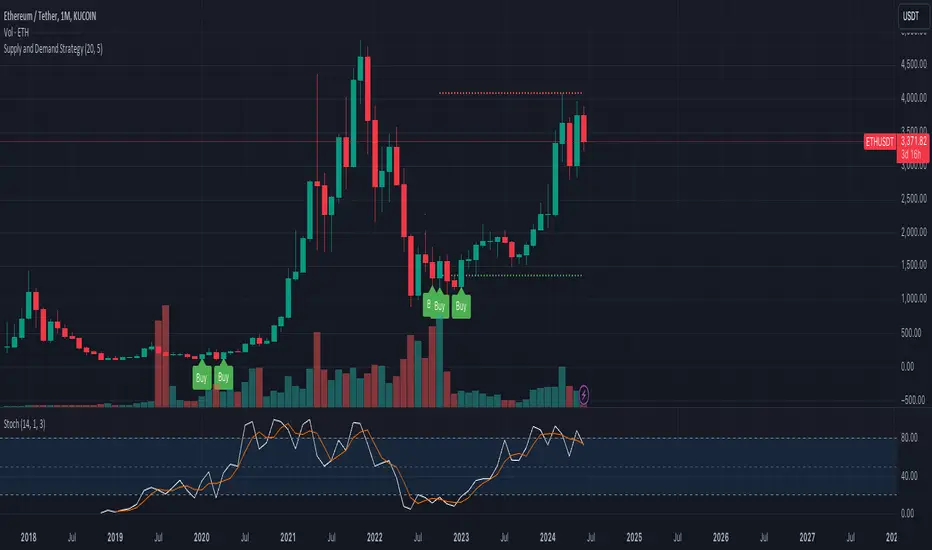
Supply and Demand Strategy

Overview
This strategy is designed to identify key supply (resistance) and demand (support) zones on a price chart. These zones represent areas where the price has historically shown a significant reaction, either bouncing up from a demand zone or dropping down from a supply zone. The strategy provides clear entry and exit points for trades based on these zones.
Key Components
Supply and Demand Zones:
Supply Zone: An area where the price has reversed from an uptrend to a downtrend. It represents a high concentration of sellers.
Demand Zone: An area where the price has reversed from a downtrend to an uptrend. It represents a high concentration of buyers.
Time Frames:
Use higher time frames (like daily or weekly) to identify key supply and demand zones.
Use lower time frames (like 1-hour or 4-hour) to pinpoint precise entry and exit points within these zones.
Confirmation:
Use price action and candlestick patterns (like pin bars or engulfing patterns) to confirm potential reversals in these zones.
开源脚本
秉承TradingView的精神,该脚本的作者将其开源,以便交易者可以查看和验证其功能。向作者致敬!您可以免费使用该脚本,但请记住,重新发布代码须遵守我们的网站规则。
免责声明
这些信息和出版物并非旨在提供,也不构成TradingView提供或认可的任何形式的财务、投资、交易或其他类型的建议或推荐。请阅读使用条款了解更多信息。
开源脚本
秉承TradingView的精神,该脚本的作者将其开源,以便交易者可以查看和验证其功能。向作者致敬!您可以免费使用该脚本,但请记住,重新发布代码须遵守我们的网站规则。
免责声明
这些信息和出版物并非旨在提供,也不构成TradingView提供或认可的任何形式的财务、投资、交易或其他类型的建议或推荐。请阅读使用条款了解更多信息。