PROTECTED SOURCE SCRIPT
已更新 Hourly High Volume Detector
Type: Multi-Timeframe Volume Spike Scanner
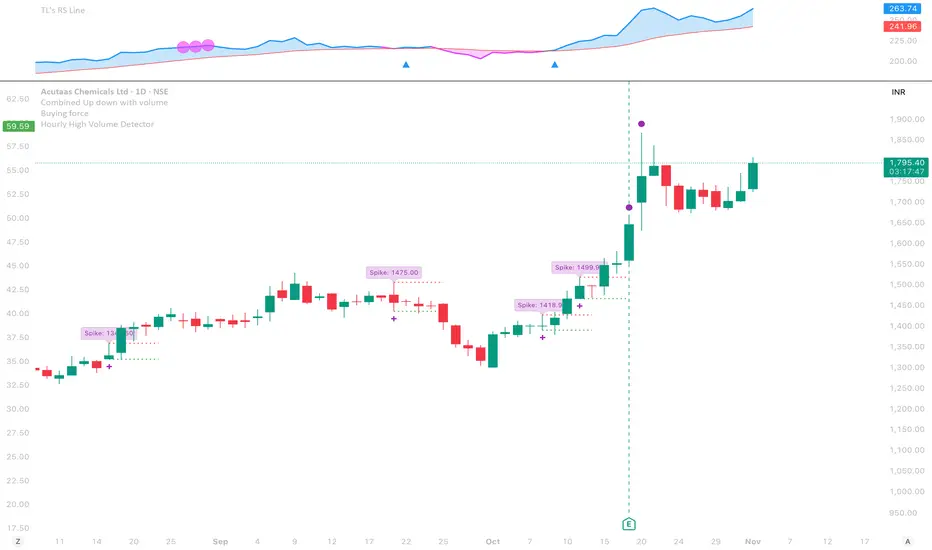
This script detects high-volume hourly candles inside each daily bar to highlight potential institutional activity or hidden accumulation days.
It automatically scans the last N days (configurable lookback) and plots a purple dot below daily candles where at least one hourly candle shows:
Volume significantly higher than the hourly average (Volume Multiplier × Avg Hourly Volume)
Positive price movement exceeding the minimum % threshold
🧠 Trend Filter
A built-in 5-day trend check ensures signals are shown only during non-downtrending phases, filtering out noise when the broader trend is weak.
⚙️ Parameters
Lookback Days: How many recent daily bars to scan.
Volume Multiplier: Defines what counts as a high-volume spike.
Min Price Change %: Minimum % gain within the hourly candle to qualify.
Debug Mode: Enables small green/orange markers for internal logic visualization.
🟣 Signals
Purple Dot (Below Candle): Strong hourly accumulation signal within the day.
(Debug) Green Dot: Hourly condition passed.
(Debug) Orange Triangle: Signal suppressed due to downtrend filter.
⚠️ Notes
Must be used on the Daily timeframe (will warn if not).
Ideal for spotting smart money accumulation, pre-breakout setups, or volume-price anomalies hidden in intraday structure.
版本注释
In this script - I have added High low lines where the hourly volume has increase by volume this lets us know the order block at what price the institutions are interested版本注释
Improved : added manual volume, provided label toggle option版本注释
I've updated the code with:New "Use Trend Filter" toggle - Turn this OFF to see if trend is blocking your signal
Enhanced debug mode - Now shows exactly what's happening:
Current trend status
Maximum volume found vs threshold needed
Maximum % change found vs minimum required
Whether signal was found
To diagnose your issue:
Turn ON "Debug Mode" in settings
Look at today's bar - you'll see a blue label with all the stats
Check if:
Max Volume > Vol Threshold? (if not, lower your multiplier)
Max % Change > Min Required? (if not, lower min price change %)
Trend Up = false? (if so, turn off "Use Trend Filter")
受保护脚本
此脚本以闭源形式发布。 但是,您可以自由使用,没有任何限制 — 了解更多信息这里。
免责声明
这些信息和出版物并非旨在提供,也不构成TradingView提供或认可的任何形式的财务、投资、交易或其他类型的建议或推荐。请阅读使用条款了解更多信息。
受保护脚本
此脚本以闭源形式发布。 但是,您可以自由使用,没有任何限制 — 了解更多信息这里。
免责声明
这些信息和出版物并非旨在提供,也不构成TradingView提供或认可的任何形式的财务、投资、交易或其他类型的建议或推荐。请阅读使用条款了解更多信息。