OPEN-SOURCE SCRIPT
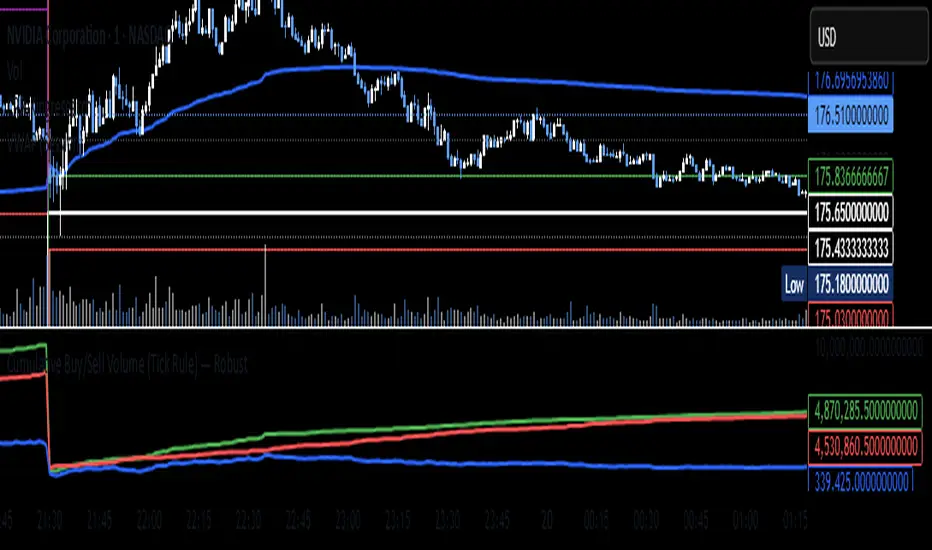
Cumulative Buy/Sell Volume (Tick Rule) — Robust
//version=5
indicator("Cumulative Buy/Sell Volume (Tick Rule) — Robust", overlay=false)
// ------- User inputs -------
resetDaily = input.bool(true, "Reset cumulative at new day/session")
showBarHist = input.bool(false, "Show per-bar buy/sell histogram")
useHalfOnEqual = input.bool(true, "Split volume 50/50 when price unchanged")
// ------- Safe previous close and volume -------
prevClose = nz(close[1], close) // avoid na on first bar
vol = float(volume)
// ------- Classification (Tick Rule approximation) -------
buyVol = close > prevClose ? vol : (close < prevClose ? 0.0 : (useHalfOnEqual ? vol * 0.5 : 0.0))
sellVol = close < prevClose ? vol : (close > prevClose ? 0.0 : (useHalfOnEqual ? vol * 0.5 : 0.0))
// ------- Cumulative totals (with optional daily reset) -------
var float cumBuy = 0.0
var float cumSell = 0.0
newDay = time("D") != time("D")[1]
if resetDaily and newDay
cumBuy := 0.0
cumSell := 0.0
cumBuy := cumBuy + buyVol
cumSell := cumSell + sellVol
cumDelta = cumBuy - cumSell
// ------- Plots -------
plot(cumBuy, title="Cumulative Buy Volume", color=color.green, linewidth=2)
plot(cumSell, title="Cumulative Sell Volume", color=color.red, linewidth=2)
plot(cumDelta, title="Cumulative Delta (Buy - Sell)", color=color.blue, linewidth=2)
// optional: per-bar histograms
plot(showBarHist ? buyVol : na, style=plot.style_columns, title="Bar Buy Vol", color=color.new(color.green, 60))
plot(showBarHist ? sellVol : na, style=plot.style_columns, title="Bar Sell Vol", color=color.new(color.red, 60))
开源脚本
本着TradingView的真正精神,此脚本的创建者将其开源,以便交易者可以查看和验证其功能。向作者致敬!虽然您可以免费使用它,但请记住,重新发布代码必须遵守我们的网站规则。
免责声明
这些信息和出版物并不意味着也不构成TradingView提供或认可的金融、投资、交易或其它类型的建议或背书。请在使用条款阅读更多信息。
开源脚本
本着TradingView的真正精神,此脚本的创建者将其开源,以便交易者可以查看和验证其功能。向作者致敬!虽然您可以免费使用它,但请记住,重新发布代码必须遵守我们的网站规则。
免责声明
这些信息和出版物并不意味着也不构成TradingView提供或认可的金融、投资、交易或其它类型的建议或背书。请在使用条款阅读更多信息。