OPEN-SOURCE SCRIPT
已更新 RippleWave Version 1
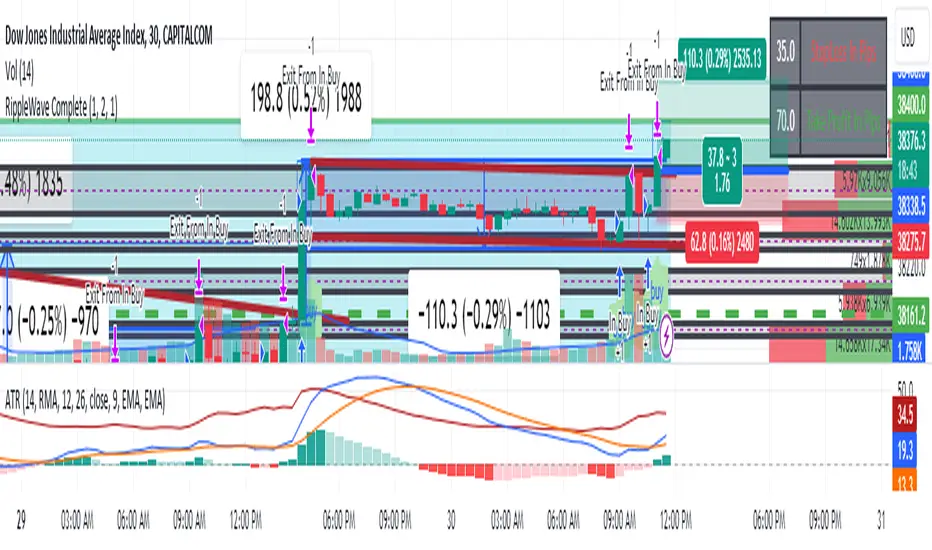
This script utilizes the trading idea concept shown by the TradingRush Youtube Channel with the usage of the MACD, and 200 EMA with my modification based on my limited understanding of the financial market, risk appetite and trading objectives. I wanted to be in and out. I call it RippleWave, It uses 200 EMA, and ATR to place stop loss in its current iteration. It does not need the MACD.
Rules
Once the price closes above the 200 EMA twice then it Buys, while the price is above the line as long as the price does not touch 200EMA, then it will continue you buying as soon as a low with higher volume is established. If the price touches the line at any point then it will wait for either a buy when two consecutive candles close above the 200EMA, if the two candles close below 200 EMA it is considered a sell and the system is designed to continue trading while the price is below the EMA. Stop loss is default set by ATR at 1 to 2 but can be customized.
The system has four modes, namely new sell, new buy, already in by trend, and already in sell trend. So if the price first goes from below the 200EMA and then closes two candles above then this is a new buy, the same rules apply for new sell and as the price conditions to stay above the stored value for the new buy then it is already buying, and the same for already selling.
As of right now, since I am a beginner in Pine Script, the current system may produce an already buy or sell when it is a new sell or buy because it only looks at finished candles and not the highs and lows touching the line. it is a trend-based indicator strategy that will underperform during consolidating markets and may give false signals. With forex pairs is best to use the 30min time frame including BTCUSD, It works well with usS30 as well. With sp500 or slower indices you may want to use 4hr and then Gold perhaps 1hr or 4hr. I can't code stop loss yet, but feel free to help me...especially if the strategy sucks and you see an improvement.
版本注释
I have tried adding the back test date filter and then trading time so that it simulates when I actually trade to get an improved win rate, it is not the best strategy depending on slippage and commission however on good asy you can pass a prop firm challenge when you use additional market analysis, note this is indicator based and does not factor support and resistance yet, I am looking to how to code when the price freezee at the 200 EMAS版本注释
Updated Script to show signals on chart as to when to enter and when to exit, will be working to see when I can draw the stop loss and take profit labels in next update. I now have auto alerts which I am testing to see if I hits take profit if it will give multiple signal alerts版本注释
Because of trading view functionality i have took out the backtested orders since the cold behaved when rules confirm entering multiple trades at the same time, i deidecide less is more so you just see the signals版本注释
The new features added atr display for stop loss and take profit by user input and using the lables tp indicate a buy or sell entry therefore users do not need to use macd with atr, you can use the macd for extra confimration the code will stop either when stop loss is hit or when the atr slows down开源脚本
秉承TradingView的精神,该脚本的作者将其开源,以便交易者可以查看和验证其功能。向作者致敬!您可以免费使用该脚本,但请记住,重新发布代码须遵守我们的网站规则。
Providing Trading Tools and Tips
免责声明
这些信息和出版物并非旨在提供,也不构成TradingView提供或认可的任何形式的财务、投资、交易或其他类型的建议或推荐。请阅读使用条款了解更多信息。
开源脚本
秉承TradingView的精神,该脚本的作者将其开源,以便交易者可以查看和验证其功能。向作者致敬!您可以免费使用该脚本,但请记住,重新发布代码须遵守我们的网站规则。
Providing Trading Tools and Tips
免责声明
这些信息和出版物并非旨在提供,也不构成TradingView提供或认可的任何形式的财务、投资、交易或其他类型的建议或推荐。请阅读使用条款了解更多信息。