OPEN-SOURCE SCRIPT
Order Block
Overview:
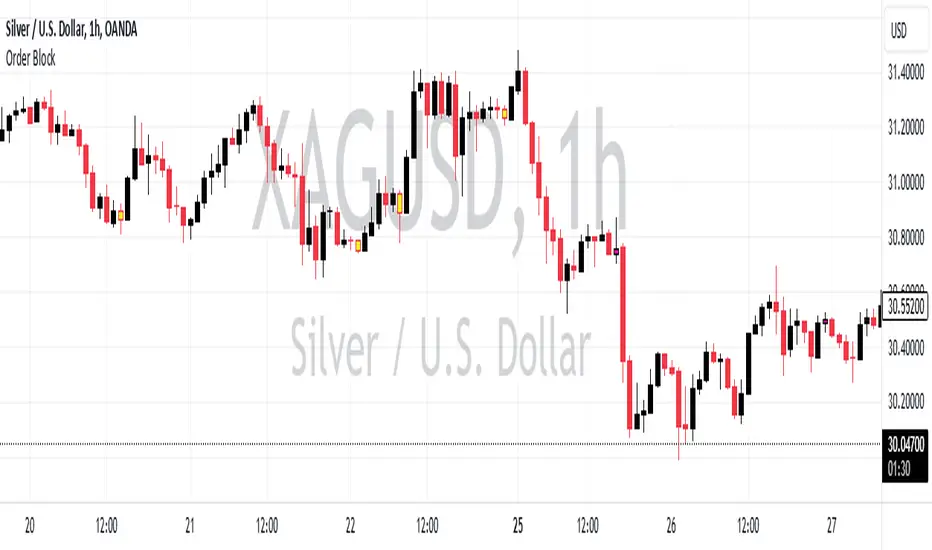
The Order Block Indicator is designed to help traders identify key bullish and bearish order blocks on their charts. Order blocks are significant price zones where institutional activity may have occurred, often leading to strong reversals or continuations. This indicator visually highlights these blocks and provides alerts for potential trade opportunities.
Key Features
Bullish Order Blocks (Yellow):
Identifies bullish structures where price signals a potential upward movement.
Highlighted in bright yellow to stand out on your chart.
Bearish Order Blocks (Pink):
Detects bearish structures where price suggests a possible downward movement.
Highlighted in pink for easy identification.
Alerts for Order Blocks:
Sends a notification whenever a bullish or bearish order block is detected.
Keeps you informed of key market zones even when you’re away from the screen.
How It Works
Bullish Order Block Criteria
The last candle (close[1]) is bullish (close > open).
The second last candle (close[2]) is bearish (close < open).
The bullish candle’s close is above the high of the bearish candle.
The bearish candle’s close is above the low of the third last candle.
The bearish candle’s low is below the low of the third last candle.
The current candle’s low is above the bearish candle’s high.
These conditions combine to identify strong bullish zones.
Bearish Order Block Criteria
The last candle (close[1]) is bearish (close < open).
The second last candle (close[2]) is bullish (close > open).
The bearish candle’s close is below the low of the bullish candle.
The third last candle’s high is above the bullish candle’s close.
The bullish candle’s high is above the high of the third last candle.
The current candle’s high is below the bullish candle’s low.
This logic highlights potential bearish zones.
How to Use It
Add the Indicator to Your Chart:
Use it on any timeframe to spot bullish or bearish order blocks.
Visual Assistance:
Yellow bars indicate bullish order blocks.
Pink bars represent bearish order blocks.
Set Alerts:
Configure alerts to notify you when a bullish or bearish order block appears.
Customization
Colors: Easily change the colors for bullish and bearish order blocks.
Alerts: Adjust alert messages to suit your trading preferences.
Disclaimer:
This indicator is a technical analysis tool and should be used alongside other strategies and market analysis. It does not guarantee profits and carries trading risks. Always trade responsibly.
开源脚本
秉承TradingView的精神,该脚本的作者将其开源,以便交易者可以查看和验证其功能。向作者致敬!您可以免费使用该脚本,但请记住,重新发布代码须遵守我们的网站规则。
免责声明
这些信息和出版物并非旨在提供,也不构成TradingView提供或认可的任何形式的财务、投资、交易或其他类型的建议或推荐。请阅读使用条款了解更多信息。
免责声明
这些信息和出版物并非旨在提供,也不构成TradingView提供或认可的任何形式的财务、投资、交易或其他类型的建议或推荐。请阅读使用条款了解更多信息。