OPEN-SOURCE SCRIPT
Buffett Indicator (Wilshire 5000 / GDP)
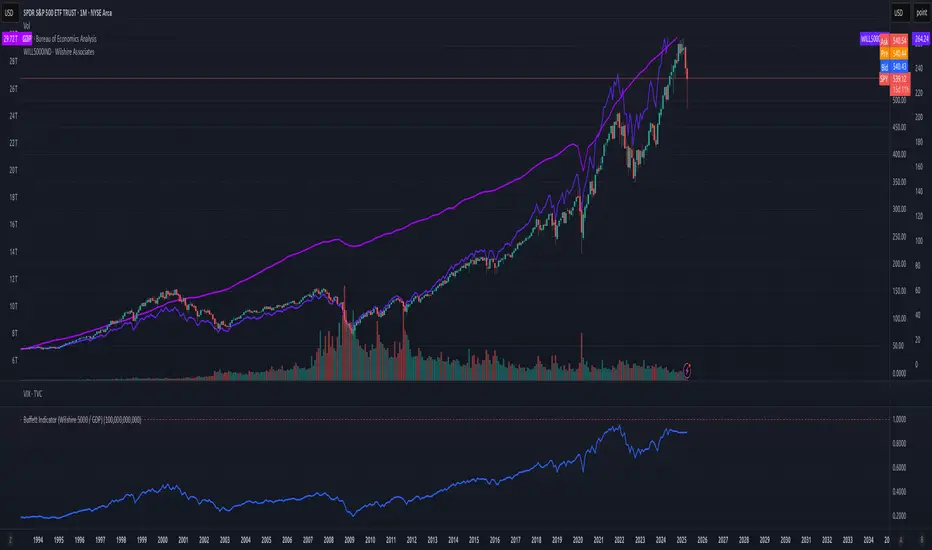
The Buffett Indicator (Wilshire 5000 / GDP) is a macroeconomic metric used to assess whether the U.S. stock market is overvalued or undervalued. It is calculated by dividing the total market capitalization (represented by the Wilshire 5000 Index) by the U.S. Gross Domestic Product (GDP). A value above 1 (or 100%) may indicate an overvalued market, while a value below 1 suggests potential undervaluation. This indicator is best suited for long-term investment analysis.
开源脚本
秉承TradingView的精神,该脚本的作者将其开源,以便交易者可以查看和验证其功能。向作者致敬!您可以免费使用该脚本,但请记住,重新发布代码须遵守我们的网站规则。
免责声明
这些信息和出版物并非旨在提供,也不构成TradingView提供或认可的任何形式的财务、投资、交易或其他类型的建议或推荐。请阅读使用条款了解更多信息。
免责声明
这些信息和出版物并非旨在提供,也不构成TradingView提供或认可的任何形式的财务、投资、交易或其他类型的建议或推荐。请阅读使用条款了解更多信息。