OPEN-SOURCE SCRIPT
已更新 Quantum Flow Tracker
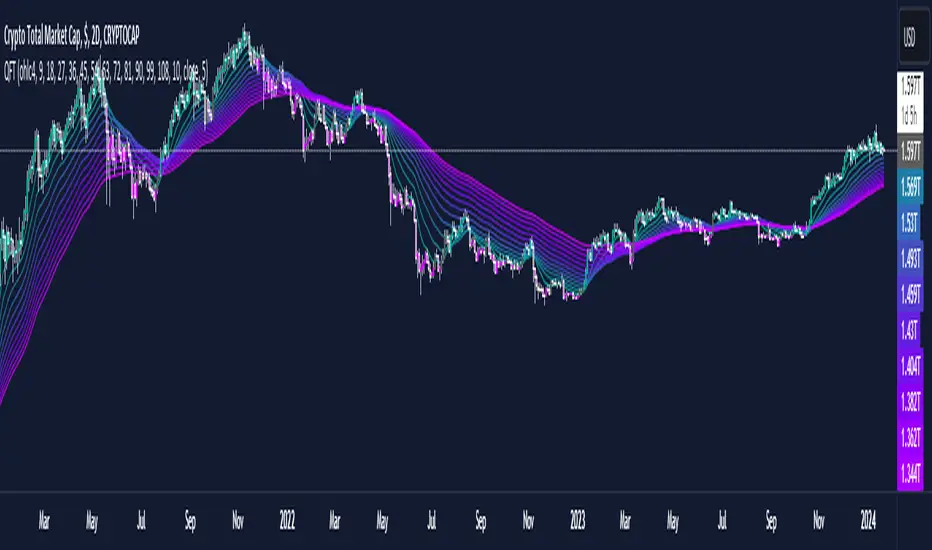
This indicator is designed to capture trends in financial markets by utilizing an Exponential Moving Average (EMA) and the Relative Strength Index (RSI).
Multiple EMAs
The indicator plots multiple EMAs with varying lengths on the chart. Users can customize the lengths of these EMAs using the input parameters.
RSI (Relative Strength Index)
The RSI is calculated based on user-defined length and source inputs.
Additionally, the RSI is smoothed using an Exponential Moving Average (EMA) with a customizable length.
Trend Conditions
The indicator defines uptrend and downtrend conditions based on the relationship between the closing price, the first EMA and the EMA of RSI .
An uptrend (Green Color) is identified when the closing price is above ema1 and the smoothed RSI is above 50.
A downtrend (Purple Color) is identified when the closing price is below ema1 and the smoothed RSI is below 50.
A neutral state (Gray Color) suggests that the trend may be weakening, potentially indicating a forthcoming trend reversal or a period of indecision in the market.
This indicator provides a visual representation of trend directions and can be customized to adjust the sensitivity and frequency of trend changes.
Disclaimer: This indicator is provided for educational and informational purposes only.
It is not intended as financial advice or as a tool for making financial decisions.
Users are advised to conduct their own research and seek the advice of a qualified financial professional before making any investment decisions. The creator of this indicator is not responsible for any financial losses incurred as a result of using this indicator.
版本注释
Default values for the EMAs error changed.开源脚本
秉承TradingView的精神,该脚本的作者将其开源,以便交易者可以查看和验证其功能。向作者致敬!您可以免费使用该脚本,但请记住,重新发布代码须遵守我们的网站规则。
🔍 Access Investing Strategies & Indicators
📊 whop.com/marktquant
🌐 marktquant.com
Nothing shared on this page constitutes financial advice. All information, tools, and analyses are provided solely for informational and educational purposes.
📊 whop.com/marktquant
🌐 marktquant.com
Nothing shared on this page constitutes financial advice. All information, tools, and analyses are provided solely for informational and educational purposes.
免责声明
这些信息和出版物并非旨在提供,也不构成TradingView提供或认可的任何形式的财务、投资、交易或其他类型的建议或推荐。请阅读使用条款了解更多信息。
开源脚本
秉承TradingView的精神,该脚本的作者将其开源,以便交易者可以查看和验证其功能。向作者致敬!您可以免费使用该脚本,但请记住,重新发布代码须遵守我们的网站规则。
🔍 Access Investing Strategies & Indicators
📊 whop.com/marktquant
🌐 marktquant.com
Nothing shared on this page constitutes financial advice. All information, tools, and analyses are provided solely for informational and educational purposes.
📊 whop.com/marktquant
🌐 marktquant.com
Nothing shared on this page constitutes financial advice. All information, tools, and analyses are provided solely for informational and educational purposes.
免责声明
这些信息和出版物并非旨在提供,也不构成TradingView提供或认可的任何形式的财务、投资、交易或其他类型的建议或推荐。请阅读使用条款了解更多信息。