OPEN-SOURCE SCRIPT
Supply and Demand Anchored [LuxAlgo]
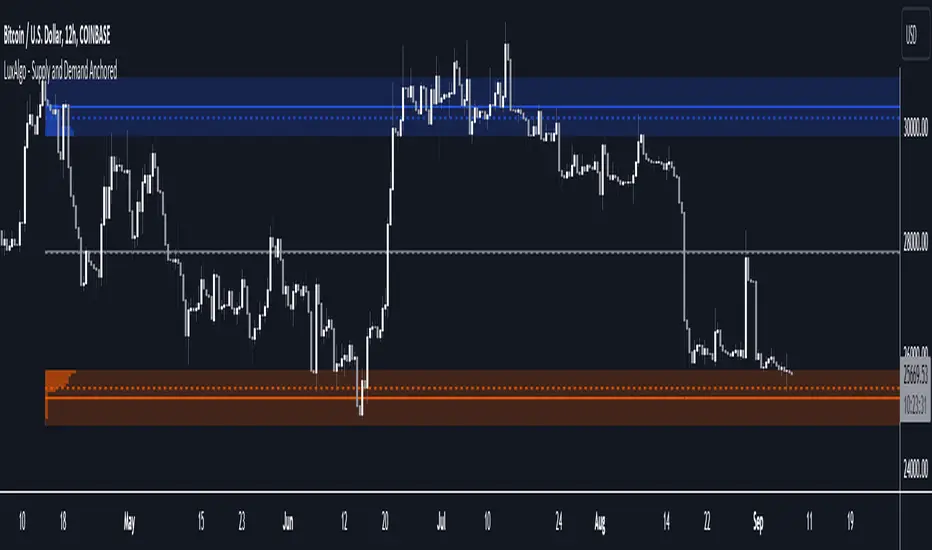
The Supply and Demand Anchored indicator is an anchored version of the popular Supply and Demand Visible Range indicator. Once adding the indicator to the chart, users need to manually select the starting and ending points for the indicator's calculation. The estimated supply/demand zones are then extended.
🔶 USAGE

The proposed indicator makes use of the same method highlighted in previous posts (see related scripts section below) to estimate supply and demand zones.
When adding the indicator to the chart, users will be prompted to select a starting and ending point for the calculation of the supply and demand zones, click on your chart to select those points.

Once calculated, each zone/level will be extended to the right of the chart. These can be used as support/resistance zones. Clicking on one of the graphical elements of the indicator or the indicator title will highlight the starting and ending calculation points, these can be dragged to be set at different locations.
🔶 SETTINGS
🔶 RELATED SCRIPTS
![Supply and Demand Visible Range [LuxAlgo]](https://s3.tradingview.com/u/UpWXXsbC_mid.png)
![Supply and Demand Daily [LuxAlgo]](https://s3.tradingview.com/r/rc0kPSGU_mid.png)
🔶 USAGE
The proposed indicator makes use of the same method highlighted in previous posts (see related scripts section below) to estimate supply and demand zones.
When adding the indicator to the chart, users will be prompted to select a starting and ending point for the calculation of the supply and demand zones, click on your chart to select those points.
Once calculated, each zone/level will be extended to the right of the chart. These can be used as support/resistance zones. Clicking on one of the graphical elements of the indicator or the indicator title will highlight the starting and ending calculation points, these can be dragged to be set at different locations.
🔶 SETTINGS
- Threshold %: Percentage of the total visible range volume used as a threshold to set supply/demand areas. Higher values return wider areas.
- Resolution: Determines the number of bins used to find each area. Higher values will return more precise results.
- Intra-bar TF: Timeframe used to obtain intra-bar data.
🔶 RELATED SCRIPTS
开源脚本
秉承TradingView的精神,该脚本的作者将其开源,以便交易者可以查看和验证其功能。向作者致敬!您可以免费使用该脚本,但请记住,重新发布代码须遵守我们的网站规则。
Get exclusive indicators & AI trading strategies: luxalgo.com
Free 150k+ community: discord.gg/lux
All content provided by LuxAlgo is for informational & educational purposes only. Past performance does not guarantee future results.
Free 150k+ community: discord.gg/lux
All content provided by LuxAlgo is for informational & educational purposes only. Past performance does not guarantee future results.
免责声明
这些信息和出版物并非旨在提供,也不构成TradingView提供或认可的任何形式的财务、投资、交易或其他类型的建议或推荐。请阅读使用条款了解更多信息。