INVITE-ONLY SCRIPT
MostPower MagicBox - Premium
已更新
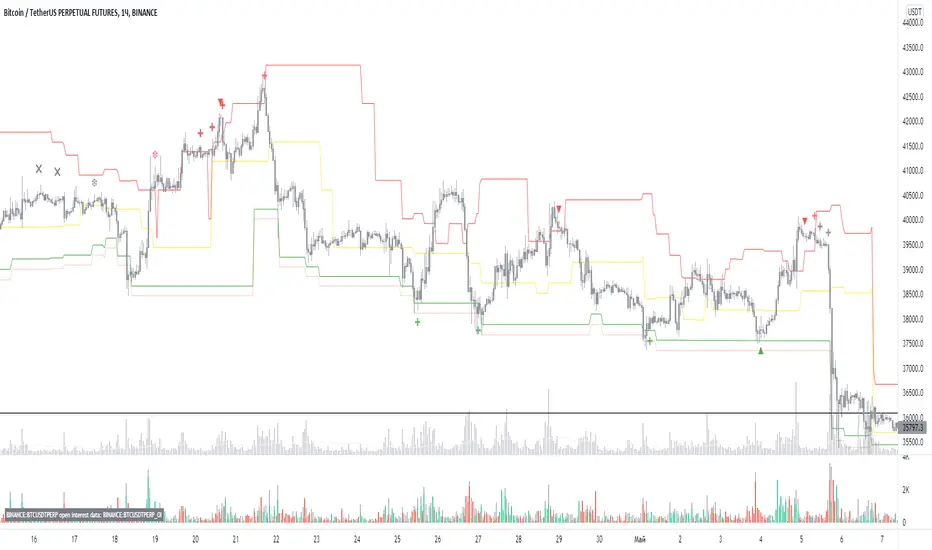
MostPower MagicBox - Premium - This indicator is designed to find support and resistance levels in real time.
How to use ?
Yellow line - This is the main level
The red and green lines are the boundaries of the main level.
You can enter a deal both from the main level and from its border, which is a safer deal.
In the settings, you can select the mode of operation of the levels you need, the timeframe for the calculation and configure it as you need.
It is important to understand that this must be used by everyone in a company with an overall trading strategy.
Settings:
There are three types of quality levels
Weak - displays weaker levels suitable for shorter-term trades.
Medium - displays average quality levels, suitable for more average deals.
Strong - displays strong quality levels, suitable for longer trades (recommended).
Timeframe
In the Timeframe settings you can select the desired timeframe for the calculation.
Traps
Short squeeze from below (long ones not in traps)
Sellers ran into the boundaries of the red line. A balance to lower prices began to form. This is the end of the trend continuation. If we decode the data correctly, it will indicate to us that the market agrees to a decline.
The fact that a strong main (yellow) level is formed below and the price is below it indicates that the market is not interested in taking profit. Therefore, any potential rebound is likely to cause sellers to rapidly increase their short positions. This is a pattern that can lead to a slight pullback before the trend continues.
Short top pull (long into traps)
All of the buyers at the top who contributed to the increase in value are now trapped, which means that any bounce to the major (yellow) level is an interesting proposition to add short positions, especially if it is orphaned by the main trend.
Unlike a downtrend structure, this short tends to bounce more as market participants cannot find a good spot. This ultimately leads to exhaustion before a potential price recovery (expected rebound) within the market pricing mechanism. When this pattern occurs, any continuation of the decline without a prior bounce carries the risk of exhaustion and capture of slow and weak sellers, unless there is a significant increase in the value of these newly formed lower prices.
Below I will show one of the possible nuances that you may encounter.
We see that the red line has accumulated many buyers, but they could not make up some value in combination with the closing of the price below the main (yellow) level, it screams about danger.
Long Bottom Zip (Shorts in Traps)
Unlike in the past, we now find ourselves with a bullish structure forming a downward squeeze.
When this happens, our hypothesis should always be that until new pockets of liquidity are created for the longs at these highs, this type of structure will run the risk that the move will end (exhaustion), leading to a strong pullback. It is in this type of retracement that we can see the best opportunities for long as price returns to retest the area in which sellers were trapped earlier.
Long top zip (no shorts in traps)
In this situation, there is a risk of an immediate continuation of the trend. If you look at the example graph below, this is exactly the case when buyers will not be overwhelmed by the imbalance in the supply.
Despite the backward environment, the environment will still be favorable for the search for buying opportunities as the latest data suggests that both buyers and sellers have agreed to higher price levels.
When these structures emerge, buyers who have maintained such a high price are not going to give up without a fight, and this is where downturn buying opportunities tend to arise. This pattern tends to create an initial false move that depletes itself before price magnetically pulls back to the previous major (yellow) level where the next battle will take place.
Putting it all together
We have come to the end of this tutorial. Remember, you must consider these new concepts as part of a holistic approach to markets. If you don't understand your surroundings without doing proper multi-timeframe research, you may be missing out on some of the picture.
版本注释
- Fix版本注释
- Fix bugs版本注释
- Fix bugs版本注释
- Update to Pine Script 5版本注释
- Fixed Bugs版本注释
- Fix bugs版本注释
- Fix bugs版本注释
- Fix Bugs版本注释
-Fix bugs版本注释
- Fix bugs版本注释
- Fix bugs版本注释
- Fix bugs仅限邀请脚本
仅限作者授权的用户访问此脚本,并且通常需要付费。您可以将其添加到收藏中,但是只有在向作者请求并获得许可之后,才能使用它。 请联系mostpower-app了解更多信息,或按照以下作者的说明操作。
TradingView不建议付费使用脚本,除非您100%信任作者并了解脚本的工作原理。在许多情况下,您可以在我们的社区脚本免费找到不错的开源替代方案。
作者的说明
″Get instant access to our premium indicators: https://mostpower.app/
想在图表上使用此脚本?
警告:请在申请访问权限之前阅读。
免责声明
这些信息和出版物并不意味着也不构成TradingView提供或认可的金融、投资、交易或其它类型的建议或背书。请在使用条款阅读更多信息。