OPEN-SOURCE SCRIPT
30-Week SMA (Fixed)

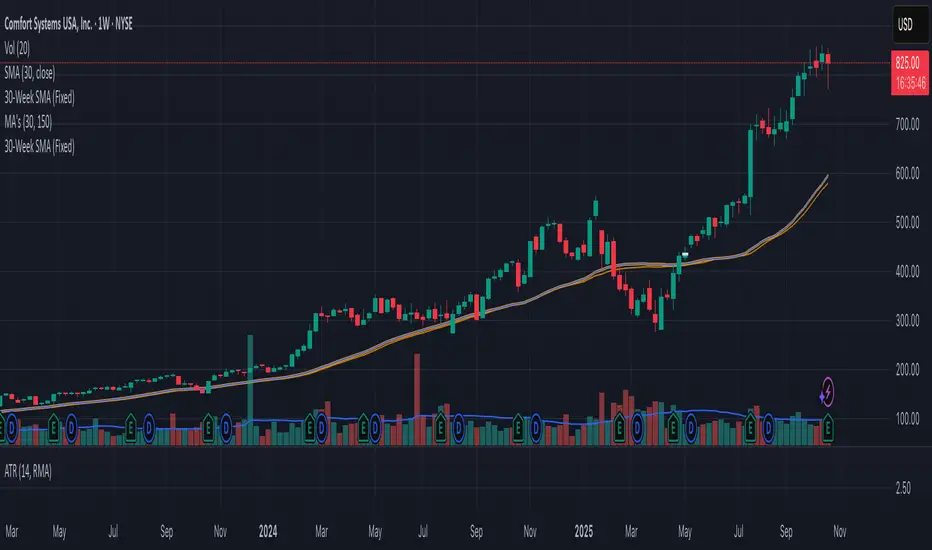
This indicator plots a true 30-week Simple Moving Average (SMA) on any chart, regardless of the selected timeframe.
It uses weekly candle data (via the request.security() function) to calculate the 30-week average and keeps it fixed — meaning the line remains accurate even when you switch to daily, 4-hour, or other timeframes.
The 30-week SMA is a cornerstone of Stan Weinstein’s Stage Analysis strategy, commonly used to identify major trend phases:
Above a rising SMA → bullish (Stage 2 uptrend)
Below a falling SMA → bearish (Stage 4 downtrend)
Use this indicator to maintain a consistent long-term trend filter on all timeframes
开源脚本
秉承TradingView的精神,该脚本的作者将其开源,以便交易者可以查看和验证其功能。向作者致敬!您可以免费使用该脚本,但请记住,重新发布代码须遵守我们的网站规则。
免责声明
这些信息和出版物并非旨在提供,也不构成TradingView提供或认可的任何形式的财务、投资、交易或其他类型的建议或推荐。请阅读使用条款了解更多信息。
开源脚本
秉承TradingView的精神,该脚本的作者将其开源,以便交易者可以查看和验证其功能。向作者致敬!您可以免费使用该脚本,但请记住,重新发布代码须遵守我们的网站规则。
免责声明
这些信息和出版物并非旨在提供,也不构成TradingView提供或认可的任何形式的财务、投资、交易或其他类型的建议或推荐。请阅读使用条款了解更多信息。