INVITE-ONLY SCRIPT
已更新 Chartpunk Trading System
INTRODUCTION
I am happy to present the system which I am using in my daily free market updates.
The system is based on my own trading strategy whereby I am focusing on trend and momentum. I have developed this indicator for my own using, the main purpose was to provide me with a simplified outlook on all parameters that I am following, and make it easier to follow multiple assets.
I am amazed to see my audience growing, and since I have received multiple requests for access to this system, I have decided to publish the indicator on TradingView. I hope it will be useful for many of you in understanding core trend and momentum easier and faster.
TREND STRUCTURE
The moving average based system developed by the late Tyler Jenks has made a big impression to me years ago, and I have started to build my position trading system around his concept. The core idea is that when analyzing trend, the price "is just noise". Tyler declared that instead of the actual price, you should focus on price trends, based on three moving averages, their alignment and crosses. Focusing on the trend structure provides you with a cleaner understanding of the market then being fixated on the actual price. Tyler has used a very short moving average (3) instead of the price, and two longer averages (7 and 30) to identify trend direction. The alignment of these three moving averages provide you with guidance on whether to be short or long, and on the extent of being short or long. Further to the alignment of these moving averages, their direction (ascending or descending) is a further aspect to consider. Try taking off the price from your chart, you will see how these three moving averages provide you with a clean trend structure.
This indicator is plotting the 3,7,30 moving averages accordingly, but you are free to alter the settings according to your own needs.
MOMENTUM (Multi Timeframe!)
Further to the general trend structure, I am using market momentum to confirm my entries and exits. The most important market indicators to me in this respect are the RSI, DMI and Momentum Oscillator values. A bullish confluence of these momentum indicators are a confirmation for me on a long entry, and a bearish confluence may confirm a short entry.
This aspect is where I believe my indicator is a huge help. Instead of having to check for confluence separately, the indicator is simply signaling confluence by painting the bars, thus providing an easy and quick reading of current momentum.
Even further, the indicator is able to analyize the underlying indicators on three timeframes simultaneously, and paint the candles only in case of total confluence. This has been a huge help in my trading, as it provides me with an immediate MTF momentum reading upon opening a chart.
MY PREFERRED USE OF THIS INDICATOR
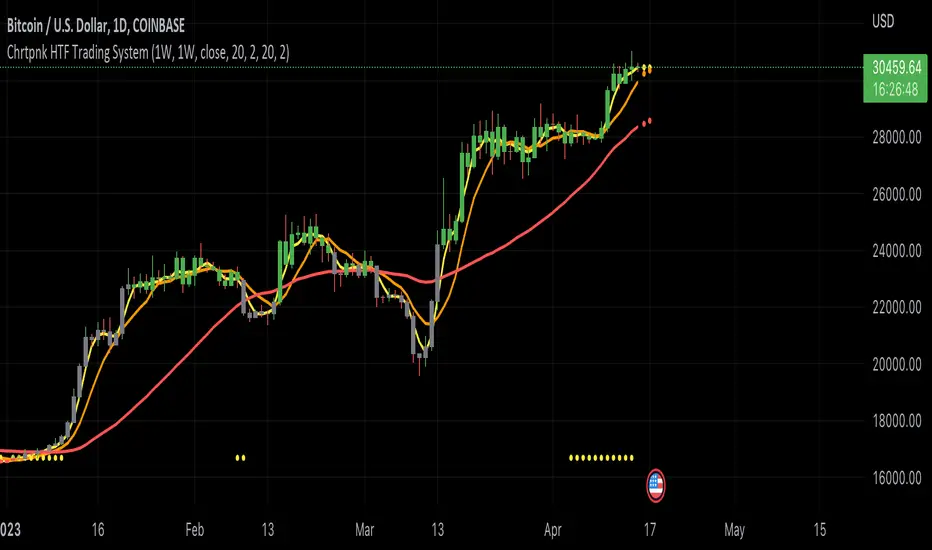
I am mainly trading Bitcoin, and the core settings of the indicator are preset according to my experience on this market. You may however easily alter the settings according to your own needs and approach.
I am opening and closing positions on the 1-day timeframe, and the candles are showing to me momentum confluence on the 1-day, 3-day and 1-week timeframes. Hence, if on all three timeframes there is a bullish confluence of all momentum oscillators (RSI, Mom, DMI), the candles are green. So easy, as I do not have to browse through timeframes and oscillators individually. The bearish confluence is accordingly signaled by red candles. Grey candles are neutral, showing the lack of confluence.
Whenever I see a momentum confluence change (neutral to bull, neutral to bear etc.), I analyze the trend structure of the moving averages. If the moving average structure is confirming the position, I am opening.
SUMMARY
This indicator is providing a very clean and quick-to-read outlook of an otherwise rather time and focus intensive study. Instead of checking for confluence of three momentum indicators on three timeframes, you immediately see confluence with the candle paint. The moving average structure is promptly there to confirm the read. This is where the real power of this indicator is lying, and I assume this is why the more and more of you have started to daily follow my daily market updates.
I am happy to present the system which I am using in my daily free market updates.
The system is based on my own trading strategy whereby I am focusing on trend and momentum. I have developed this indicator for my own using, the main purpose was to provide me with a simplified outlook on all parameters that I am following, and make it easier to follow multiple assets.
I am amazed to see my audience growing, and since I have received multiple requests for access to this system, I have decided to publish the indicator on TradingView. I hope it will be useful for many of you in understanding core trend and momentum easier and faster.
TREND STRUCTURE
The moving average based system developed by the late Tyler Jenks has made a big impression to me years ago, and I have started to build my position trading system around his concept. The core idea is that when analyzing trend, the price "is just noise". Tyler declared that instead of the actual price, you should focus on price trends, based on three moving averages, their alignment and crosses. Focusing on the trend structure provides you with a cleaner understanding of the market then being fixated on the actual price. Tyler has used a very short moving average (3) instead of the price, and two longer averages (7 and 30) to identify trend direction. The alignment of these three moving averages provide you with guidance on whether to be short or long, and on the extent of being short or long. Further to the alignment of these moving averages, their direction (ascending or descending) is a further aspect to consider. Try taking off the price from your chart, you will see how these three moving averages provide you with a clean trend structure.
This indicator is plotting the 3,7,30 moving averages accordingly, but you are free to alter the settings according to your own needs.
MOMENTUM (Multi Timeframe!)
Further to the general trend structure, I am using market momentum to confirm my entries and exits. The most important market indicators to me in this respect are the RSI, DMI and Momentum Oscillator values. A bullish confluence of these momentum indicators are a confirmation for me on a long entry, and a bearish confluence may confirm a short entry.
This aspect is where I believe my indicator is a huge help. Instead of having to check for confluence separately, the indicator is simply signaling confluence by painting the bars, thus providing an easy and quick reading of current momentum.
Even further, the indicator is able to analyize the underlying indicators on three timeframes simultaneously, and paint the candles only in case of total confluence. This has been a huge help in my trading, as it provides me with an immediate MTF momentum reading upon opening a chart.
MY PREFERRED USE OF THIS INDICATOR
I am mainly trading Bitcoin, and the core settings of the indicator are preset according to my experience on this market. You may however easily alter the settings according to your own needs and approach.
I am opening and closing positions on the 1-day timeframe, and the candles are showing to me momentum confluence on the 1-day, 3-day and 1-week timeframes. Hence, if on all three timeframes there is a bullish confluence of all momentum oscillators (RSI, Mom, DMI), the candles are green. So easy, as I do not have to browse through timeframes and oscillators individually. The bearish confluence is accordingly signaled by red candles. Grey candles are neutral, showing the lack of confluence.
Whenever I see a momentum confluence change (neutral to bull, neutral to bear etc.), I analyze the trend structure of the moving averages. If the moving average structure is confirming the position, I am opening.
SUMMARY
This indicator is providing a very clean and quick-to-read outlook of an otherwise rather time and focus intensive study. Instead of checking for confluence of three momentum indicators on three timeframes, you immediately see confluence with the candle paint. The moving average structure is promptly there to confirm the read. This is where the real power of this indicator is lying, and I assume this is why the more and more of you have started to daily follow my daily market updates.
版本注释
The calibration settings of the base momentum indicators have been frozen.版本注释
Rename of indicator description on chart版本注释
Based on community feedback I amended the alert conditions. You can now alert the crosses of the short and medium moving averages. Enjoy!版本注释
I have added a volatility squeeze monitoring option to the system. The script now is monitoring low volatility periods, and signals them on the chart. Low volatility periods are usually followed by expansion, so the plots might be able to prepare a breakout trade. Also the volatility squeeze periods are periods where the crosses of the two short MA's might be handled with some additional attention in the Consensio trading system.仅限邀请脚本
只有作者授权的用户才能访问此脚本。您需要申请并获得使用许可。通常情况下,付款后即可获得许可。更多详情,请按照下方作者的说明操作,或直接联系panickyChile85473。
TradingView不建议您付费购买或使用任何脚本,除非您完全信任其作者并了解其工作原理。您也可以在我们的社区脚本找到免费的开源替代方案。
作者的说明
Please contact me privately if you wish to have access to the indicator. My students signing up to my training suite will automatically get access. Follow my Twitter or YouTube for updates.
免责声明
这些信息和出版物并非旨在提供,也不构成TradingView提供或认可的任何形式的财务、投资、交易或其他类型的建议或推荐。请阅读使用条款了解更多信息。
仅限邀请脚本
只有作者授权的用户才能访问此脚本。您需要申请并获得使用许可。通常情况下,付款后即可获得许可。更多详情,请按照下方作者的说明操作,或直接联系panickyChile85473。
TradingView不建议您付费购买或使用任何脚本,除非您完全信任其作者并了解其工作原理。您也可以在我们的社区脚本找到免费的开源替代方案。
作者的说明
Please contact me privately if you wish to have access to the indicator. My students signing up to my training suite will automatically get access. Follow my Twitter or YouTube for updates.
免责声明
这些信息和出版物并非旨在提供,也不构成TradingView提供或认可的任何形式的财务、投资、交易或其他类型的建议或推荐。请阅读使用条款了解更多信息。