OPEN-SOURCE SCRIPT
SwRp – HTF Candle Box Overlay
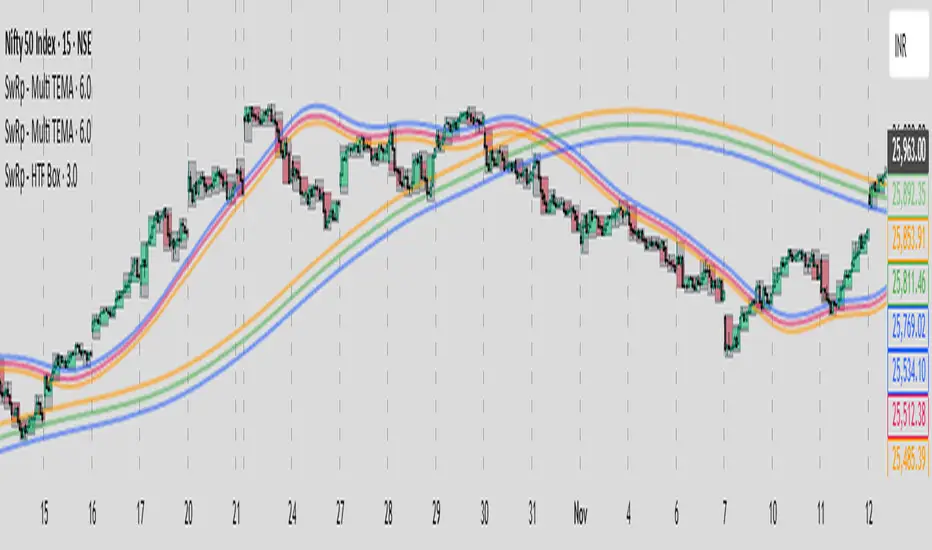
SwRp – HTF Candle Box Overlay gives you a clear visual map of higher-timeframe candles directly on your lower-timeframe chart. Instead of switching timeframes, you can see the structure of each HTF candle plotted as colored boxes that update in real time as the candle forms.
Each HTF candle is drawn using two elements:
• A wick box showing the full high-to-low range
• A body box showing the open-to-close move with automatic bull/bear coloring
Both boxes follow the exact HTF open, high, low and close values, and they stay correctly anchored to price using bar-time positioning. You can customize opacity, body/wick visibility, border color, and the number of HTF candles to keep on the chart. The indicator automatically removes older candles when they exceed your set limit, so the chart stays clean.
This tool is ideal for traders who want to see HTF structure, zones, and candle behavior while analyzing entries and exits on smaller timeframes.
Key Features
• Overlay higher-timeframe candles on lower-timeframe charts
• Real-time updating of HTF candle body and wick
• Bull/bear body coloring with full opacity controls
• Independent toggles for body and wick fills
• Automatically remove older HTF candles to keep the chart clean
• Accurate price anchoring using bar-time for all boxes
• No extra lines, labels, or clutter — a clean visual multi-timeframe view
This indicator offers a simple, clear way to track the behavior of higher-timeframe candles without leaving your current chart, helping you combine HTF context with LTF execution more effectively.
开源脚本
秉承TradingView的精神,该脚本的作者将其开源,以便交易者可以查看和验证其功能。向作者致敬!您可以免费使用该脚本,但请记住,重新发布代码须遵守我们的网站规则。
免责声明
这些信息和出版物并非旨在提供,也不构成TradingView提供或认可的任何形式的财务、投资、交易或其他类型的建议或推荐。请阅读使用条款了解更多信息。
免责声明
这些信息和出版物并非旨在提供,也不构成TradingView提供或认可的任何形式的财务、投资、交易或其他类型的建议或推荐。请阅读使用条款了解更多信息。