INVITE-ONLY SCRIPT
Key Levels with RTH-Only Lines and End-of-Line Labels
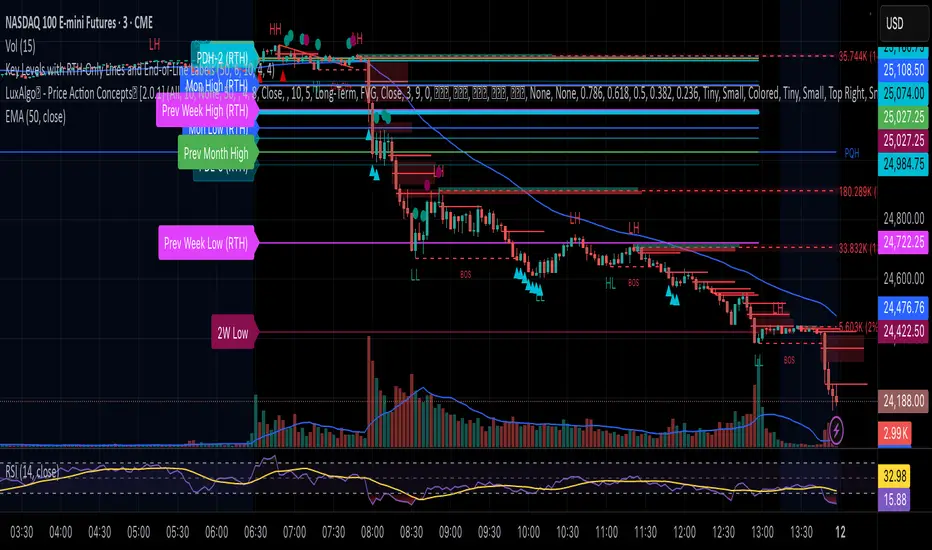
This script plots important market structure levels such as Premarket High/Low, Previous Day High/Low, Monday High/Low, Weekly and Monthly Highs/Lows — but only during Regular Trading Hours (RTH) to keep the chart clean and focused on the active session.
Each level is automatically updated based on session data and is visually extended across the current trading day using line breaks (plot.style_linebr). At the start of each RTH session, the script also places end-of-line labels identifying each level (e.g., PDH, PDL, Mon High, Mon Low, Weekly High/Low, Monthly High/Low), allowing traders to quickly reference key zones without clutter.
This tool is ideal for:
Futures and equity traders who rely on session-based support and resistance levels.
Identifying reaction points where liquidity often builds — such as prior highs/lows or weekly extremes.
Maintaining focus on live market structure while avoiding noise from premarket or overnight price action.
Additional features:
All levels and labels are plotted only during RTH for visual clarity.
Supports custom labeling and alert logic extensions for breakout or retest strategies.
Built with scalability in mind — works across different symbols and timeframes.
仅限邀请脚本
只有作者授权的用户才能访问此脚本。您需要申请并获得使用许可。通常情况下,付款后即可获得许可。更多详情,请按照下方作者的说明操作,或直接联系govind220。
TradingView不建议您付费购买或使用任何脚本,除非您完全信任其作者并了解其工作原理。您也可以在我们的社区脚本找到免费的开源替代方案。
作者的说明
This script plots important market structure levels such as Premarket High/Low, Previous Day High/Low, Monday High/Low, Weekly and Monthly Highs/Lows — but only during Regular Trading Hours (RTH) to keep the chart clean and focused on the active session.
免责声明
这些信息和出版物并非旨在提供,也不构成TradingView提供或认可的任何形式的财务、投资、交易或其他类型的建议或推荐。请阅读使用条款了解更多信息。