OPEN-SOURCE SCRIPT
CVD with Trend Line
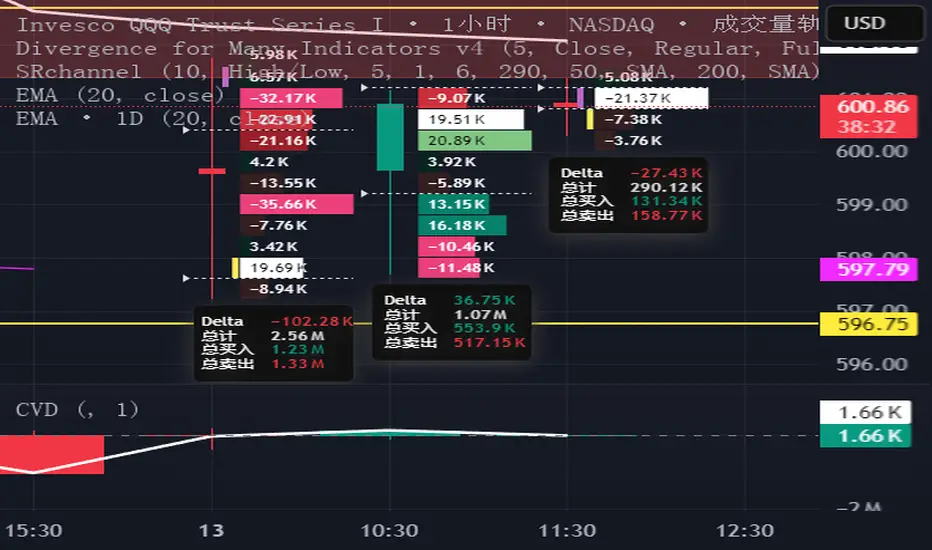
This indicator augments the traditional Cumulative Volume Delta (CVD) by incorporating a customizable trend line that connects the tops of the CVD histogram bars, enhancing visualization of delta trends and market momentum. The CVD measures the net difference between buying and selling volume, utilizing lower timeframe data for accuracy, with configurable anchor periods and timeframe options. The trend line, which can be tailored in both color and style (e.g., solid, dashed), provides traders with a flexible tool to track cumulative delta movements, aiding in the identification of market sentiment shifts. Perfect for volume-based analysis with a clear, adaptable display.
开源脚本
秉承TradingView的精神,该脚本的作者将其开源,以便交易者可以查看和验证其功能。向作者致敬!您可以免费使用该脚本,但请记住,重新发布代码须遵守我们的网站规则。
免责声明
这些信息和出版物并非旨在提供,也不构成TradingView提供或认可的任何形式的财务、投资、交易或其他类型的建议或推荐。请阅读使用条款了解更多信息。
免责声明
这些信息和出版物并非旨在提供,也不构成TradingView提供或认可的任何形式的财务、投资、交易或其他类型的建议或推荐。请阅读使用条款了解更多信息。