OPEN-SOURCE SCRIPT
已更新 Volume Pressure
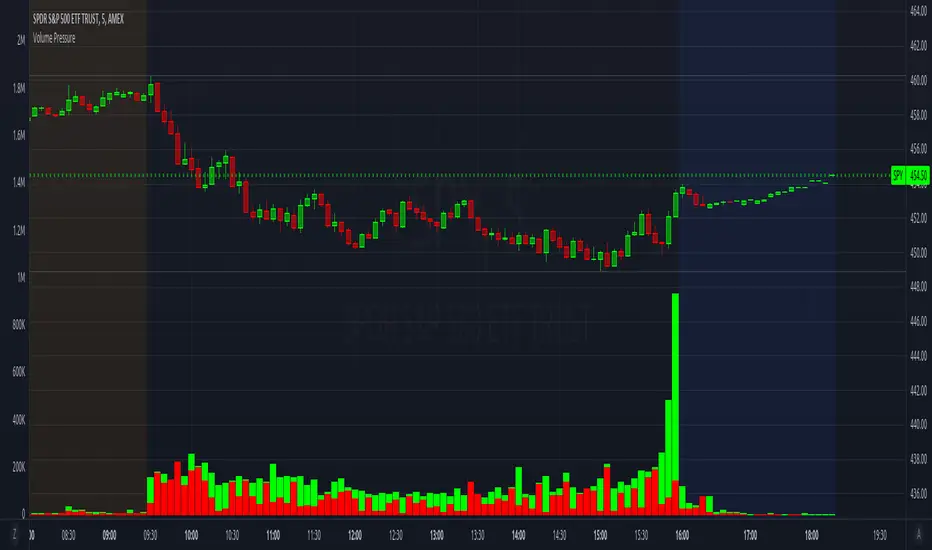
Breaks down volume into buyers (green part) vs sellers (red part).
It is recommended to set the volume's scale, especially if you switch tickers on the same chart. Follow these steps:
To update to the latest version, just close the indicator and add it again.
It is recommended to set the volume's scale, especially if you switch tickers on the same chart. Follow these steps:
- Select the Volume Pressure indicator's 3 dots (...)
- Select Pin To Scale
- Select a separate scale from the main chart, such as Pin To New Left Scale (Z)
- Left click and hold the scale on the side of the chart and drag it up/down to bring the volume bars into the desired area
To update to the latest version, just close the indicator and add it again.
版本注释
Additional info on the Volume Pressure bars:On a green candle:
- The red part represents the upper wick, the volume as the price comes back down from its high
- The green part represents the rest of the candle, the volume as the price goes up from its low to the close
On a red candle:
- The green part represents the lower wick, the volume as the price comes back up from its low
- The red part represents the rest of the candle, the volume as the price goes down from its high to the close
版本注释
Added scale property to force it to the left side; this should prevent it from using the chart's main price scale and filling the screen版本注释
Updated screenshot版本注释
Fixed problem with volume bars jumping around when switching between tickers. Added a hidden scale line that keeps them relatively consistent.开源脚本
秉承TradingView的精神,该脚本的作者将其开源,以便交易者可以查看和验证其功能。向作者致敬!您可以免费使用该脚本,但请记住,重新发布代码须遵守我们的网站规则。
免责声明
这些信息和出版物并非旨在提供,也不构成TradingView提供或认可的任何形式的财务、投资、交易或其他类型的建议或推荐。请阅读使用条款了解更多信息。
开源脚本
秉承TradingView的精神,该脚本的作者将其开源,以便交易者可以查看和验证其功能。向作者致敬!您可以免费使用该脚本,但请记住,重新发布代码须遵守我们的网站规则。
免责声明
这些信息和出版物并非旨在提供,也不构成TradingView提供或认可的任何形式的财务、投资、交易或其他类型的建议或推荐。请阅读使用条款了解更多信息。