PROTECTED SOURCE SCRIPT
Burt's Multi-EMA Ribbon
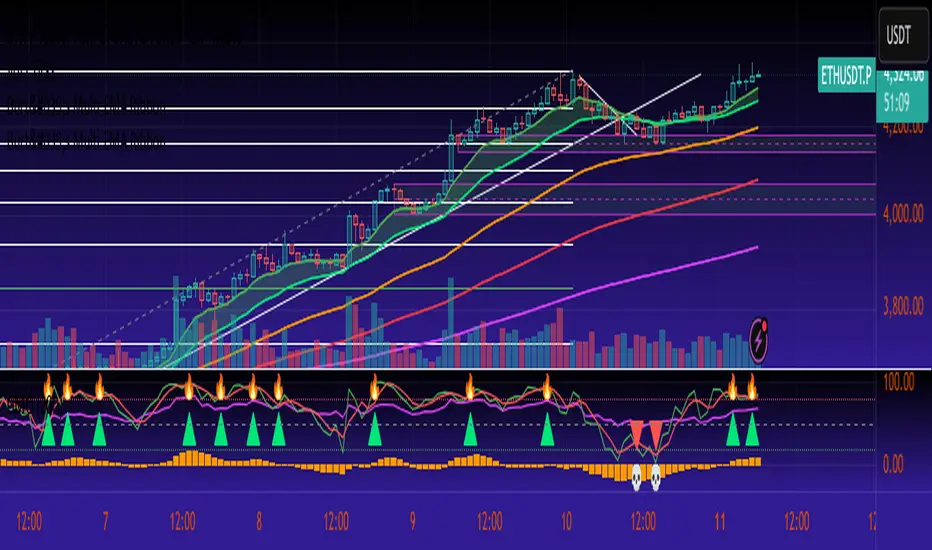
Burt’s Multi-EMA Ribbon is a simple tool for visualising multiple Exponential Moving Averages (EMAs) on the same chart.
It plots the 9, 21, 50, 100, and 200-period EMAs, allowing users to observe their relative positioning. The space between the EMA 9 and EMA 21 is shaded to highlight their relationship.
The script also includes optional alert conditions that notify when EMA 9 moves above or below EMA 21. These features can help traders monitor changes in EMA alignment without constantly watching the chart.
This indicator is intended as an analytical aid and should be used together with other forms of chart analysis. It does not provide buy or sell recommendations.
受保护脚本
此脚本以闭源形式发布。 但是,您可以自由使用,没有任何限制 — 了解更多信息这里。
免责声明
这些信息和出版物并非旨在提供,也不构成TradingView提供或认可的任何形式的财务、投资、交易或其他类型的建议或推荐。请阅读使用条款了解更多信息。
免责声明
这些信息和出版物并非旨在提供,也不构成TradingView提供或认可的任何形式的财务、投资、交易或其他类型的建议或推荐。请阅读使用条款了解更多信息。