PROTECTED SOURCE SCRIPT
已更新 Anchored OBV RSI: "V-RSI"
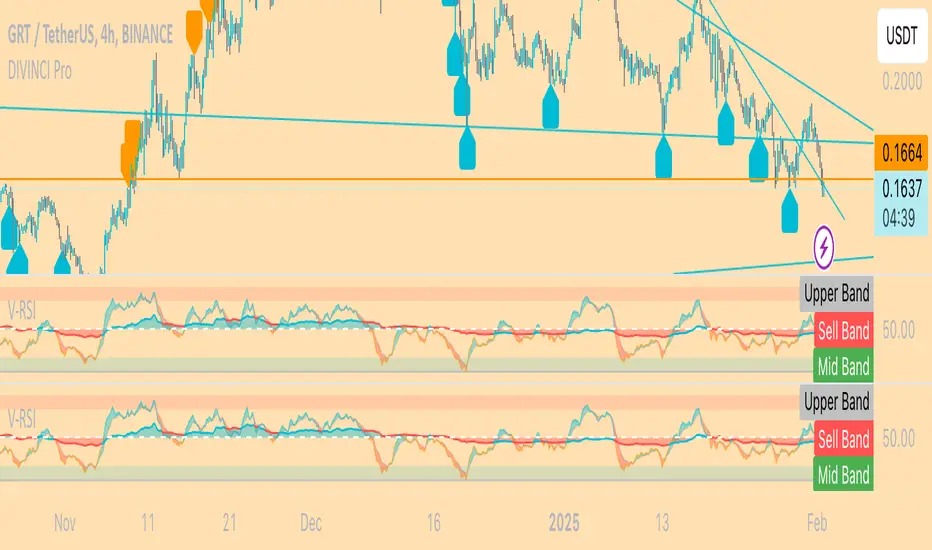
About the Indicator:
V-RSI uses values from the traditional "Relative Strength Index(RSI)" oscillator and the "On Balance Volume(OBV)" indicator and anchors them into an oscillator format. In doing so, we are given a more concrete overview of volume/sentiment data relative to the RSI for analysis of trend strength and decision making.
EXTRAS: BTC MODE => for BTC only.
In BTC MODE, the indicator uses BTC volume data from the following 5 major exchanges: BINANCE, COINBASE, FTX, BITMEX, BITFINEX.
The sum of this data is taken to depict anchored OBV values. This allows for a more accurate representation of Global Volume.
How to use it
The indicator can be used like the normal RSI with the OBV (area in the middle) showing volume sentiment.
<50 is seen as bearish
>50 is seen as bullish
Using this data, it becomes easier to identify unsustainable trends, reversals, divergences
An example of an unsustainable trend and reversal would be if RSI values are overbought ( RSI > 70) yet OBV oscillator remains below 50.
== chances of unsustainable trend reversal are more likely.
For more questions, send me a message here on Tradingview.
Happy trading,
MM :)
版本注释
BTC MODE off by default now. Turn it on when trading btc.版本注释
Added Bybit to ObV data受保护脚本
此脚本以闭源形式发布。 但是,您可以自由使用,没有任何限制 — 了解更多信息这里。
免责声明
这些信息和出版物并非旨在提供,也不构成TradingView提供或认可的任何形式的财务、投资、交易或其他类型的建议或推荐。请阅读使用条款了解更多信息。
受保护脚本
此脚本以闭源形式发布。 但是,您可以自由使用,没有任何限制 — 了解更多信息这里。
免责声明
这些信息和出版物并非旨在提供,也不构成TradingView提供或认可的任何形式的财务、投资、交易或其他类型的建议或推荐。请阅读使用条款了解更多信息。