PROTECTED SOURCE SCRIPT
Statistical Volume With Candle Colors
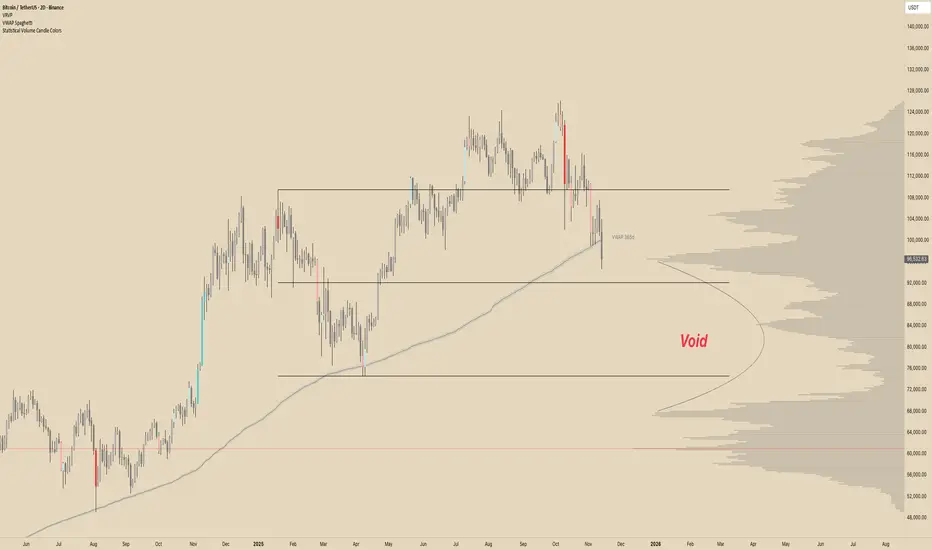
Statistical Volume Candle Colors
Statistical Volume Candle Colors is a simple, powerful tool that visually highlights candles based on how unusual their volume is compared to recent history. Instead of using fixed thresholds, it uses standard deviation statistics to identify when volume is normal, elevated, or extremely high — and colors candles accordingly.
This makes it easy to spot high-interest moments in the market where buyers or sellers stepped in aggressively.
⸻
How It Works
The script looks back over a user-defined period (default 20 candles) and calculates:
• Average volume (SMA)
• Standard deviation of volume
• Two dynamic thresholds:
• 1st standard deviation level
• 2nd standard deviation level
These levels scale automatically with market conditions, so the indicator adapts whether volume is high or low overall.
⸻
Color Logic
Each candle gets a color based on two factors:
1. Price direction
• Bullish → close ≥ open
• Bearish → close < open
2. How extreme the candle’s volume is
The script evaluates volume vs statistical thresholds:
Normal Volume
• Bullish normal → gray
• Bearish normal → dark gray
Above 1st Standard Deviation
• Bullish → light teal
• Bearish → light red
Above 2nd Standard Deviation (very high volume)
• Bullish → bright teal
• Bearish → bright red
These colors clearly separate routine candles from statistically significant ones.
⸻
Why This Is Useful
• Identify high-participation moments — where institutions or large players may be active
• Spot exhaustion or absorption — extreme volume at highs/lows
• Confirm breakouts — price moves backed by strong volume deviations
• Filter noise — see only candles that matter statistically
⸻
Customization
You can adjust:
• Lookback period (how far back to measure volume stats)
• Std dev multipliers (how strict the thresholds are)
• All colors (normal, high-volume, extreme-volume, bullish/bearish)
• Transparency level
This makes the indicator flexible for any trading style or timeframe.
⸻
In short:
Statistical Volume Candle Colors transforms standard candles into a volume-based heatmap, highlighting exactly when the market shows real interest — and when it doesn’t. It’s a simple drop-in replacement for standard candles that adds powerful context with zero extra chart clutter.
受保护脚本
此脚本以闭源形式发布。 但是,您可以自由使用,没有任何限制 — 了解更多信息这里。
免责声明
这些信息和出版物并非旨在提供,也不构成TradingView提供或认可的任何形式的财务、投资、交易或其他类型的建议或推荐。请阅读使用条款了解更多信息。
受保护脚本
此脚本以闭源形式发布。 但是,您可以自由使用,没有任何限制 — 了解更多信息这里。
免责声明
这些信息和出版物并非旨在提供,也不构成TradingView提供或认可的任何形式的财务、投资、交易或其他类型的建议或推荐。请阅读使用条款了解更多信息。