OPEN-SOURCE SCRIPT
IV Rank Oscillator by dinvestorq
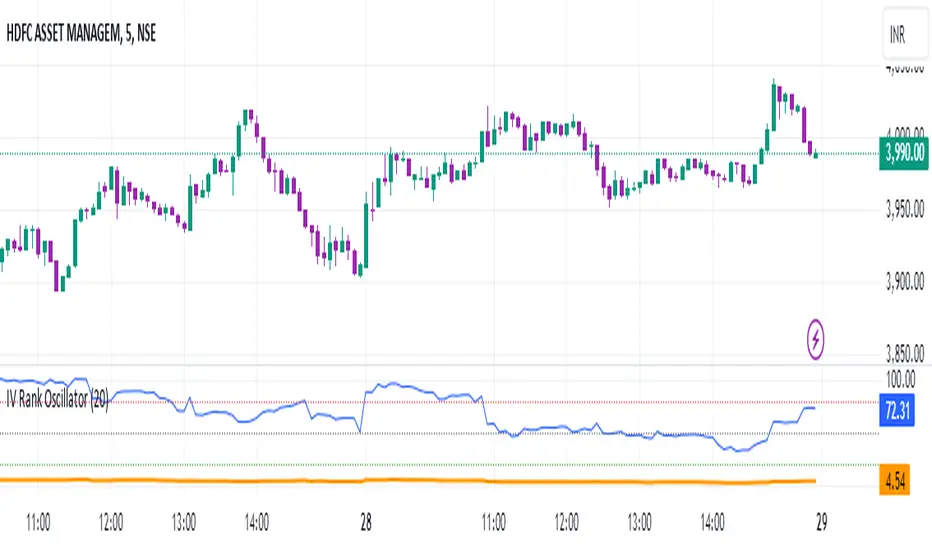
Short Title: IVR OscSlg
Description:
The IV Rank Oscillator is a custom indicator designed to measure and visualize the Implied Volatility (IV) Rank using Historical Volatility (HV) as a proxy. This indicator helps traders determine whether the current volatility level is relatively high or low compared to its historical levels over a specified period.
Key Features:
Historical Volatility (HV) Calculation: Computes the historical volatility based on the standard deviation of logarithmic returns over a user-defined period.
IV Rank Calculation: Normalizes the current HV within the range of the highest and lowest HV values over the past 252 periods (approximately one year) to generate the IV Rank.
IV Rank Visualization: Plots the IV Rank, along with reference lines at 50 (midline), 80 (overbought), and 20 (oversold), making it easy to interpret the relative volatility levels.
Historical Volatility Plot: Optionally plots the Historical Volatility for additional reference.
Usage:
IV Rank: Use the IV Rank to assess the relative level of volatility. High IV Rank values (close to 100) indicate that the current volatility is high relative to its historical range, while low IV Rank values (close to 0) indicate low relative volatility.
Reference Lines: The overbought (80) and oversold (20) lines help identify extreme volatility conditions, aiding in trading decisions.
Example Use Case:
A trader can use the IV Rank Oscillator to identify potential entry and exit points based on the volatility conditions. For instance, a high IV Rank may suggest a period of high market uncertainty, which could be a signal for options traders to consider strategies like selling premium. Conversely, a low IV Rank might indicate a more stable market condition.
Parameters:
HV Calculation Length: Adjustable period length for the historical volatility calculation (default: 20 periods).
This indicator is a powerful tool for options traders, volatility analysts, and any market participant looking to gauge market conditions based on historical volatility patterns.
开源脚本
秉承TradingView的精神,该脚本的作者将其开源,以便交易者可以查看和验证其功能。向作者致敬!您可以免费使用该脚本,但请记住,重新发布代码须遵守我们的网站规则。
免责声明
这些信息和出版物并非旨在提供,也不构成TradingView提供或认可的任何形式的财务、投资、交易或其他类型的建议或推荐。请阅读使用条款了解更多信息。
开源脚本
秉承TradingView的精神,该脚本的作者将其开源,以便交易者可以查看和验证其功能。向作者致敬!您可以免费使用该脚本,但请记住,重新发布代码须遵守我们的网站规则。
免责声明
这些信息和出版物并非旨在提供,也不构成TradingView提供或认可的任何形式的财务、投资、交易或其他类型的建议或推荐。请阅读使用条款了解更多信息。