PROTECTED SOURCE SCRIPT
Price Grid (Base/Step/Levels)
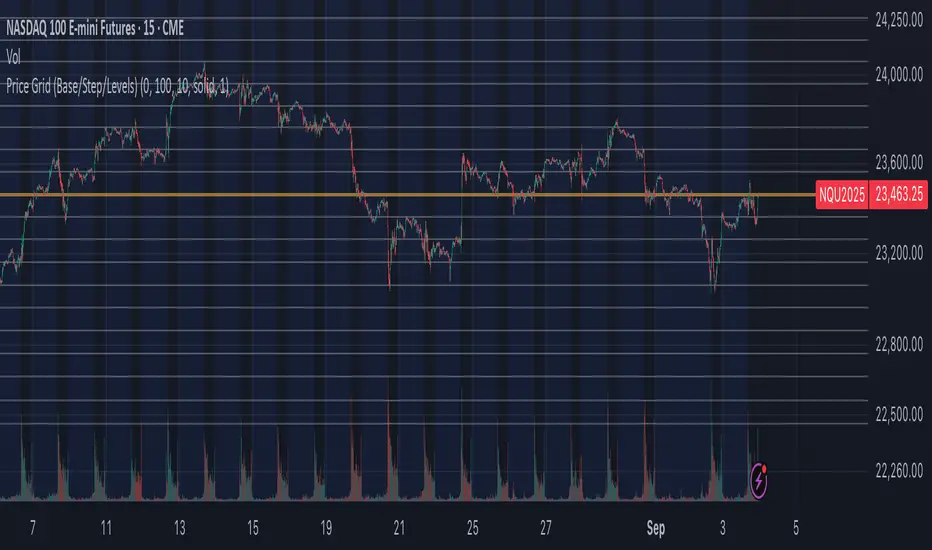
Price Grid (Base/Step/Levels) is a simple yet powerful tool for visual traders. It automatically draws a customizable grid of horizontal price levels on your chart.
You choose a base price, a grid step size, and the number of levels to display above and below. The indicator then plots evenly spaced lines around the base, helping you:
Spot round-number zones and psychological levels
Plan entries, exits, and stop-loss placements
Visualize support/resistance clusters
Build grid or ladder trading strategies
The base line is highlighted so you always know your anchor level, while the other levels are styled separately for clarity.
⚙️ Inputs
Base price → anchor level (set 0 to use current close price)
Grid step → distance between levels
Number of levels → lines drawn above & below base
Line style / width / colors → full customization
✅ Notes
Works on any market and timeframe
Automatically respects the symbol’s minimum tick size
Lightweight & non-repainting
受保护脚本
此脚本以闭源形式发布。 但是,您可以自由使用,没有任何限制 — 了解更多信息这里。
免责声明
这些信息和出版物并非旨在提供,也不构成TradingView提供或认可的任何形式的财务、投资、交易或其他类型的建议或推荐。请阅读使用条款了解更多信息。
免责声明
这些信息和出版物并非旨在提供,也不构成TradingView提供或认可的任何形式的财务、投资、交易或其他类型的建议或推荐。请阅读使用条款了解更多信息。