OPEN-SOURCE SCRIPT
Primitive Delta Divergence
Primitive Delta Divergence
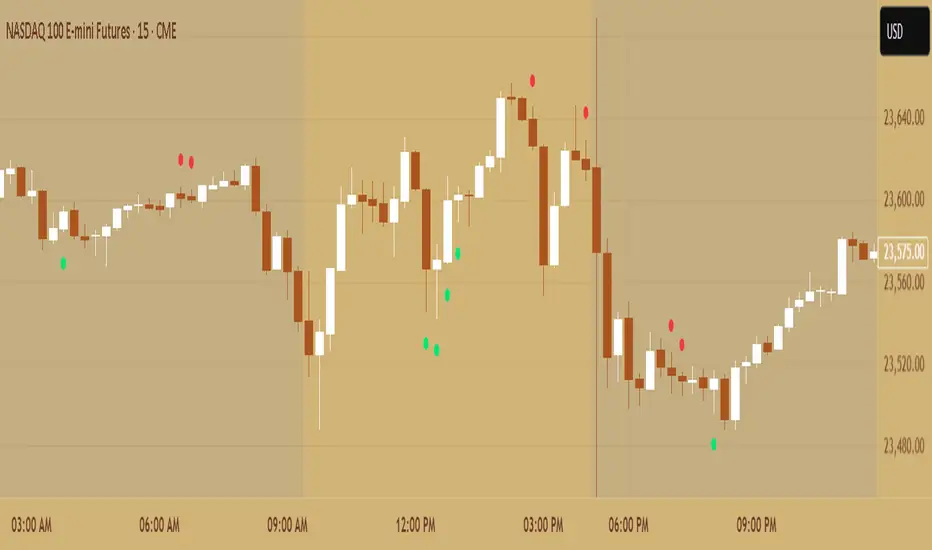
This indicator detects volume-price divergences by analyzing the relationship between price direction and volume bias over a rolling lookback period, revealing potential momentum shifts before they become apparent in price action alone.
Instead of relying solely on price movements, you can identify moments when volume sentiment contradicts price direction — a core concept borrowed from footprint chart analysis, adapted for traditional bar charts.
For example, when price moves higher but volume is predominantly bearish, or when price declines while volume shows bullish accumulation.
🔹 How it works
Lookback Period (n) → defines the rolling window for analyzing price and volume relationships
Creates a "meta-candle" from the lookback period, comparing its open vs. close for price bias
Volume classification → separates each bar's volume into bullish (green candles), bearish (red candles), or neutral (doji candles)
Volume bias calculation → generates a continuous score (-1 to +1) representing the directional volume pressure
Plots divergence signals when price direction and volume bias disagree
🔹 Use cases
Spot early momentum exhaustion when price and volume move in opposite directions
Identify potential reversal zones where volume suggests underlying weakness or strength
Enhance entry/exit timing by incorporating volume-based confirmation alongside price action
Apply footprint-style analysis to any timeframe without specialized charting tools
✨ Primitive Delta Divergence reveals the hidden story volume tells about price, uncovering divergences that traditional indicators might miss.
开源脚本
秉承TradingView的精神,该脚本的作者将其开源,以便交易者可以查看和验证其功能。向作者致敬!您可以免费使用该脚本,但请记住,重新发布代码须遵守我们的网站规则。
免责声明
这些信息和出版物并非旨在提供,也不构成TradingView提供或认可的任何形式的财务、投资、交易或其他类型的建议或推荐。请阅读使用条款了解更多信息。
开源脚本
秉承TradingView的精神,该脚本的作者将其开源,以便交易者可以查看和验证其功能。向作者致敬!您可以免费使用该脚本,但请记住,重新发布代码须遵守我们的网站规则。
免责声明
这些信息和出版物并非旨在提供,也不构成TradingView提供或认可的任何形式的财务、投资、交易或其他类型的建议或推荐。请阅读使用条款了解更多信息。