OPEN-SOURCE SCRIPT
20 EMA Undercut Bounce - M4v3r1ck
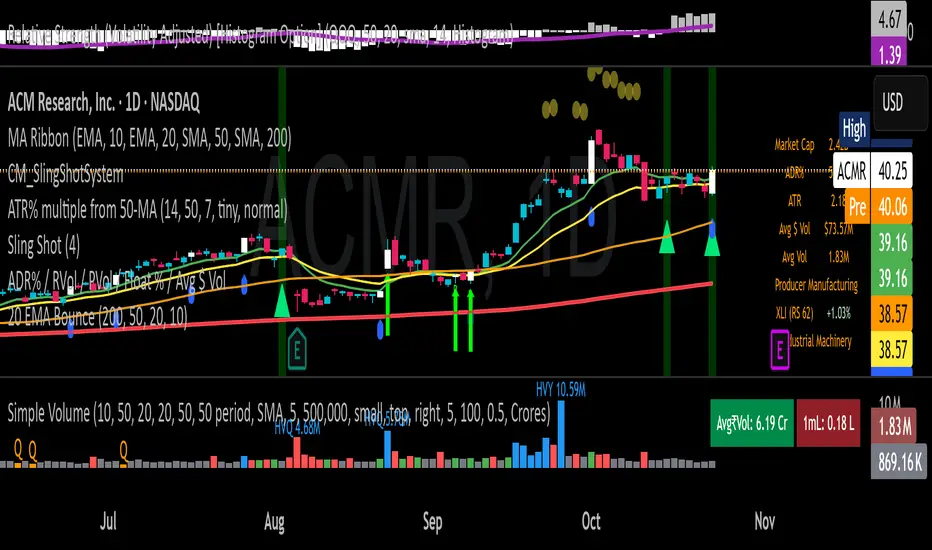
💎 The "EMA Undercut Bounce" Bullish Scanner
This indicator is designed to identify high-conviction continuation patterns where price makes a temporary dip for liquidity before resuming a powerful, established uptrend. It specifically looks for a bullish rejection off the 20-period Exponential Moving Average (EMA).
🎯 Strategy Logic
The signal is generated only on the Daily (1D) timeframe when the following five precise conditions are met on the most recent completed bar:
1. Price Action (The Undercut Bounce)
• Undercut: The bar's low price must have touched or temporarily traded below the 20-Day EMA.
• Rejection: The bar's close price must have fully recovered and closed above the 20-Day EMA. This is the classic sign of strong buying pressure defending a key support level.
2. Strong Trend Hierarchy (The Bullish Stack)
The moving averages must be perfectly stacked, confirming a robust multi-timeframe uptrend structure:
• 10-Day EMA > 20-Day EMA
• 20-Day EMA > 50-Day SMA
• 50-Day SMA > 200-Day SMA
3. Momentum Confirmation (The Upward Slope)
Both the 10-Day EMA and the 20-Day EMA must be rising from the previous day. This ensures that the short-term trend momentum is positive, ruling out signals during flat or turning markets.
💡 How to Use This Indicator
1. Timeframe: Ensure your chart is set to the Daily (1D) timeframe for accurate results.
2. Signal: A Green Background highlight and an Up-Arrow below the bar mark a confirmed signal.
3. Alerts: Use the built-in alert condition to set up notifications for stocks on your watchlist, allowing you to catch these high-quality setups without constantly monitoring charts.
This script is ideal for trend-following traders looking to enter a position after a healthy shakeout and confirmation of continued bullish commitment.
开源脚本
秉承TradingView的精神,该脚本的作者将其开源,以便交易者可以查看和验证其功能。向作者致敬!您可以免费使用该脚本,但请记住,重新发布代码须遵守我们的网站规则。
免责声明
这些信息和出版物并非旨在提供,也不构成TradingView提供或认可的任何形式的财务、投资、交易或其他类型的建议或推荐。请阅读使用条款了解更多信息。
免责声明
这些信息和出版物并非旨在提供,也不构成TradingView提供或认可的任何形式的财务、投资、交易或其他类型的建议或推荐。请阅读使用条款了解更多信息。