PROTECTED SOURCE SCRIPT
已更新 OBV Correlation [Fournier-Eaton]
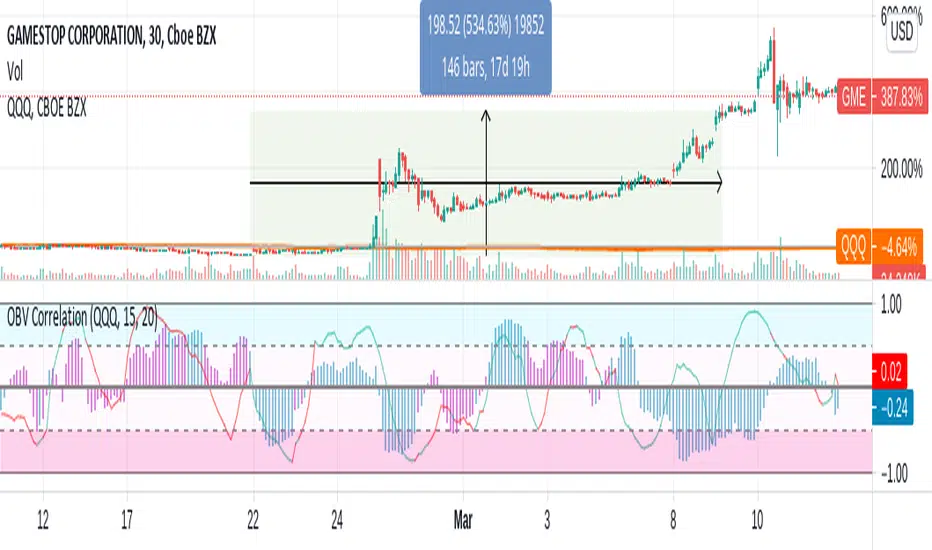
This is the On Balance Volume Correlation (And Price Correlation) Indicator. Directions of each has been encoded with color.
This Indicator is one of a series of scripts which I hope will aid in volume analysis.
If you find this at all useful, I'd love to hear from you.
Bradford Fournier-Eaton, PhD
This Indicator is one of a series of scripts which I hope will aid in volume analysis.
- The primary component is the histogram plot which represents the correlation between the direction of obv of your current equity and your chosen reference equity.
- I have included the direction of OBV for your currently plotted equity encoded as color. (Thus you know that if the plot is negative and blue, that the correlation is negative but the OBV for your current equity is increasing.)
- Furthermore, I included a supplementary price correlation line for the given equities. This line has had price direction encoded as color for quick reference.
- Thus as a quick example: if you see a blue negative histogram and an accompanying red positive line you know that: 1. obv is increasing and anti-correlated with your reference equity and the price is decreasing and positively correlated with your reference equity. A lot of information encoded in one plot.
If you find this at all useful, I'd love to hear from you.
Bradford Fournier-Eaton, PhD
版本注释
- UPDATE: obv length corrected to be independent of correlation length(s).
受保护脚本
此脚本以闭源形式发布。 但是,您可以自由使用,没有任何限制 — 了解更多信息这里。
免责声明
这些信息和出版物并非旨在提供,也不构成TradingView提供或认可的任何形式的财务、投资、交易或其他类型的建议或推荐。请阅读使用条款了解更多信息。
免责声明
这些信息和出版物并非旨在提供,也不构成TradingView提供或认可的任何形式的财务、投资、交易或其他类型的建议或推荐。请阅读使用条款了解更多信息。