OPEN-SOURCE SCRIPT
Example of Code for Moving Average Cross - Changing Colors
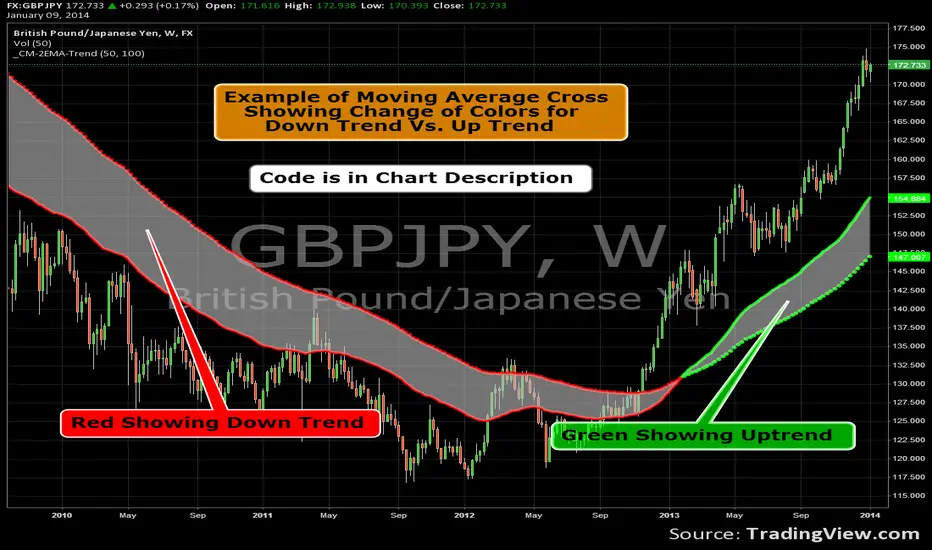
Famous 7 Time World Trading Champion Chuck Hughes found the 50 and 100 EMA to be the best Signal for a Change in Trend. Through extensive back-testing he found these EMA’s to give the earliest signal that also resulted in a Long-Term Change in Trend.
Dotted Line represents Long-Term EMA. The 100 EMA in this example.
Solid line represents the Short-Term EMA. The 50 EMA in this example.
If Short-Term EMA is ABOVE Long-Term EMA...Color = Green.
If Short-Term EMA is BELOW Long-Term EMA...Color = Red.
Dotted Line represents Long-Term EMA. The 100 EMA in this example.
Solid line represents the Short-Term EMA. The 50 EMA in this example.
If Short-Term EMA is ABOVE Long-Term EMA...Color = Green.
If Short-Term EMA is BELOW Long-Term EMA...Color = Red.
开源脚本
秉承TradingView的精神,该脚本的作者将其开源,以便交易者可以查看和验证其功能。向作者致敬!您可以免费使用该脚本,但请记住,重新发布代码须遵守我们的网站规则。
Coming Soon: ChrisMoodyTrading.com
免责声明
这些信息和出版物并非旨在提供,也不构成TradingView提供或认可的任何形式的财务、投资、交易或其他类型的建议或推荐。请阅读使用条款了解更多信息。
开源脚本
秉承TradingView的精神,该脚本的作者将其开源,以便交易者可以查看和验证其功能。向作者致敬!您可以免费使用该脚本,但请记住,重新发布代码须遵守我们的网站规则。
Coming Soon: ChrisMoodyTrading.com
免责声明
这些信息和出版物并非旨在提供,也不构成TradingView提供或认可的任何形式的财务、投资、交易或其他类型的建议或推荐。请阅读使用条款了解更多信息。