OPEN-SOURCE SCRIPT
Levels[cz]

Description
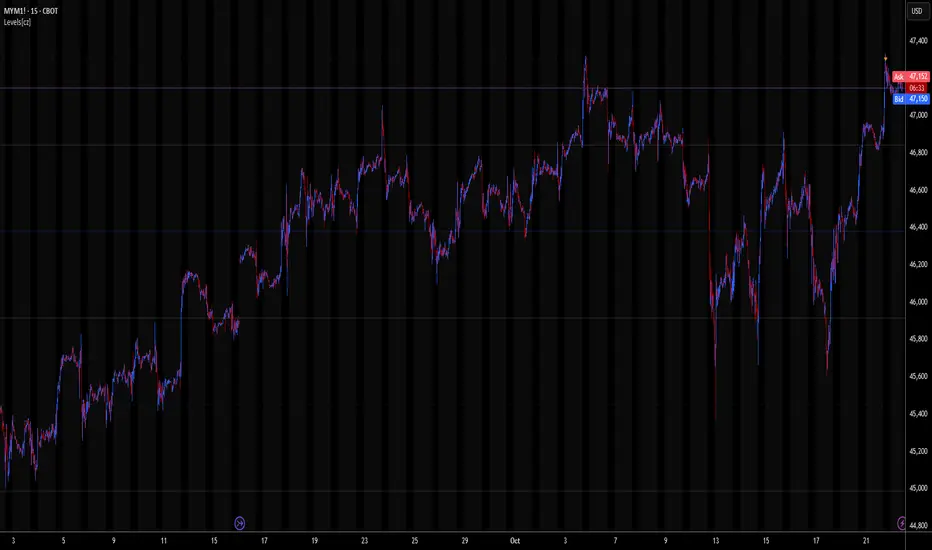
Levels[cz] is a proportional price grid indicator that draws adaptive horizontal levels based on higher timeframe (HTF) closes.
Instead of relying on swing highs/lows or pivots, it builds structured support and resistance zones using fixed percentage increments from a Daily, Weekly, or Monthly reference close.
This creates a consistent geometric framework that helps traders visualize price zones where reactions or consolidations often occur.
How It Works
Visibility is dynamically controlled by timeframe:
This ensures the right amount of structural detail at every zoom level.
How to Use
Concept
The indicator is based on the idea that markets move in proportional price steps, not random fluctuations.
By anchoring levels to a higher-timeframe close and expanding outward geometrically, Levels[cz] highlights recurring equilibrium and expansion zones — areas where traders can anticipate probable turning points or consolidations.
Features
Fully customizable colors, styles, and widths
Levels[cz] is a proportional price grid indicator that draws adaptive horizontal levels based on higher timeframe (HTF) closes.
Instead of relying on swing highs/lows or pivots, it builds structured support and resistance zones using fixed percentage increments from a Daily, Weekly, or Monthly reference close.
This creates a consistent geometric framework that helps traders visualize price zones where reactions or consolidations often occur.
How It Works
- The script retrieves the last HTF close (Daily/Weekly/Monthly).
- It then calculates percentage-based increments (e.g., 0.5%, 1%, 2%, 4%) above and below that reference.
- Each percentage forms a distinct “level group,” creating layered grids of potential reaction zones.
- Levels are automatically filtered to avoid overlap between different groups, keeping the chart clean.
Visibility is dynamically controlled by timeframe:
- Level 1 → up to 15m
- Level 2 → up to 1h
- Level 3 → up to 4h
- Level 4 → up to 1D
This ensures the right amount of structural detail at every zoom level.
How to Use
- Identify confluence zones where multiple levels cluster — often areas of strong liquidity or reversals.
- Use the grid as a support/resistance map for entries, targets, and stop placement.
- Combine with trend or momentum indicators to validate reactions at key price bands.
- Adjust the percentage increments and reference timeframe to match the volatility of your instrument (e.g., smaller steps for crypto, larger for indices).
Concept
The indicator is based on the idea that markets move in proportional price steps, not random fluctuations.
By anchoring levels to a higher-timeframe close and expanding outward geometrically, Levels[cz] highlights recurring equilibrium and expansion zones — areas where traders can anticipate probable turning points or consolidations.
Features
- 4 customizable percentage-based level sets
- Dynamic visibility by timeframe
- Non-overlapping level hierarchy
- Lightweight on performance
Fully customizable colors, styles, and widths
开源脚本
秉承TradingView的精神,该脚本的作者将其开源,以便交易者可以查看和验证其功能。向作者致敬!您可以免费使用该脚本,但请记住,重新发布代码须遵守我们的网站规则。
免责声明
这些信息和出版物并非旨在提供,也不构成TradingView提供或认可的任何形式的财务、投资、交易或其他类型的建议或推荐。请阅读使用条款了解更多信息。
开源脚本
秉承TradingView的精神,该脚本的作者将其开源,以便交易者可以查看和验证其功能。向作者致敬!您可以免费使用该脚本,但请记住,重新发布代码须遵守我们的网站规则。
免责声明
这些信息和出版物并非旨在提供,也不构成TradingView提供或认可的任何形式的财务、投资、交易或其他类型的建议或推荐。请阅读使用条款了解更多信息。