OPEN-SOURCE SCRIPT
SMA 9/50/180 + EMA 20 + ORB + BUY/SELL
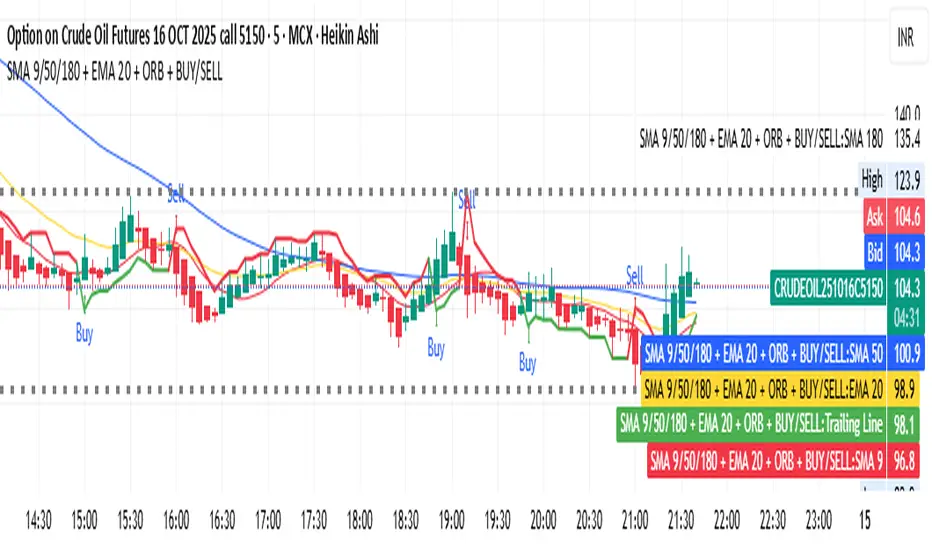
SMA + EMA + ORB + Buy/Sell indicator step by step.
🧠 1️⃣ What the Indicator Does
This TradingView script combines four systems in one:
Component Purpose
SMA 9 / 50 / 180 Shows short-, medium-, and long-term trend direction
EMA 20 Gives quicker trend signals
Buy/Sell Swing Logic Generates arrow signals based on breakout/reversal
ORB (Opening Range Breakout) Marks high and low of the market’s first few minutes (e.g. 9:15–9:20)
Together, it helps identify:
The main market trend
Entry/exit signals
Early breakout zones for intraday trading
📊 2️⃣ Moving Averages (SMA & EMA)
Indicator Meaning
SMA 9 Tracks short-term price (fast signal)
SMA 50 Tracks medium trend
SMA 180 Long-term trend direction
EMA 20 Gives quicker reactions than SMA (useful for early entries)
How to use:
When SMA9 > SMA50 > SMA180, trend = strong uptrend
When SMA9 < SMA50 < SMA180, trend = strong downtrend
So you trade in the same direction as the moving averages.
💡 3️⃣ Buy / Sell Swing Logic
This part finds small swing breakouts:
It checks the highest high and lowest low of the last few candles (default = 3).
If price closes above the previous high → Buy Signal (Green Arrow)
If price closes below the previous low → Sell Signal (Red Arrow)
It also plots a Trailing Line (TSL) that flips color:
🟢 Green line → Uptrend (price above TSL)
🔴 Red line → Downtrend (price below TSL)
Optional:
You can color bars/background to match buy/sell zones.
⏰ 4️⃣ ORB – Opening Range Breakout
Opening Range Breakout (ORB) marks the market’s first few minutes’ high and low (default 9:15–9:20).
These two lines act as important breakout zones.
If price breaks above ORB high → bullish momentum
If price breaks below ORB low → bearish momentum
Helps you trade early intraday moves confidently.
🧩 5️⃣ How to Use Together
🔼 Buy Setup
SMA9 > SMA50 → uptrend
Price near ORB High or above it
Green “Buy” arrow appears
✅ Enter Buy position
🎯 Exit near resistance (previous swing high)
🔽 Sell Setup
SMA9 < SMA50 → downtrend
Price near ORB Low or below it
Red “Sell” arrow appears
✅ Enter Sell position
🎯 Exit near next support
⚙️ 6️⃣ Customization
You can adjust:
SMA & EMA periods
ORB session time (e.g. 9:15–9:30)
Swing candle count
Color options for background/bars
✅ 7️⃣ Why It’s Useful
Benefit Description
Multi-confirmation Combines trend + breakout + swing signals
Intraday friendly ORB + fast MAs = perfect for 5–15 min charts
Visual clarity Arrows, lines, and colors show direction clearly
Alerts ready You get notifications when Buy/Sell triggers
开源脚本
本着TradingView的真正精神,此脚本的创建者将其开源,以便交易者可以查看和验证其功能。向作者致敬!虽然您可以免费使用它,但请记住,重新发布代码必须遵守我们的网站规则。
免责声明
这些信息和出版物并不意味着也不构成TradingView提供或认可的金融、投资、交易或其它类型的建议或背书。请在使用条款阅读更多信息。
开源脚本
本着TradingView的真正精神,此脚本的创建者将其开源,以便交易者可以查看和验证其功能。向作者致敬!虽然您可以免费使用它,但请记住,重新发布代码必须遵守我们的网站规则。
免责声明
这些信息和出版物并不意味着也不构成TradingView提供或认可的金融、投资、交易或其它类型的建议或背书。请在使用条款阅读更多信息。