INVITE-ONLY SCRIPT
已更新 Teddy Lite
Overview
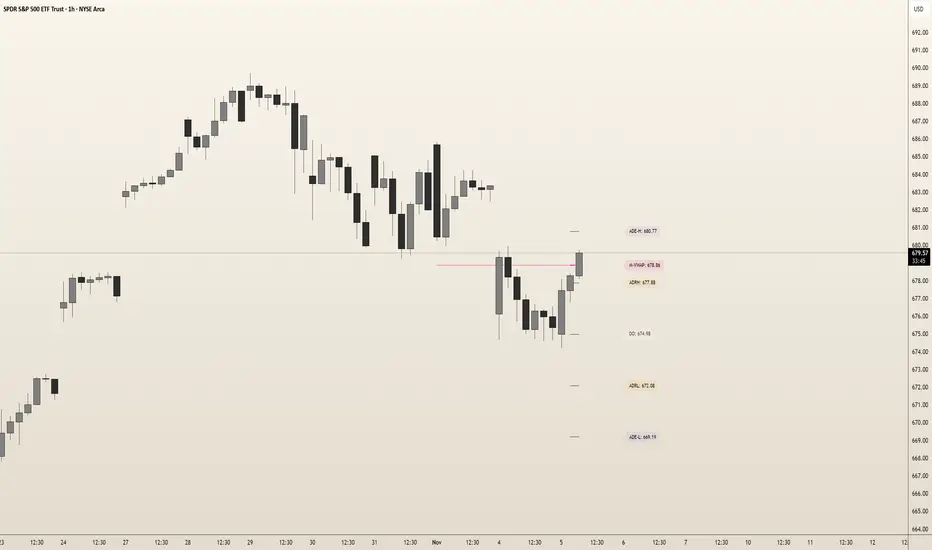
"Teddy" overlays key price levels—Daily Open (DO), Average Daily Range (ADR), and ADR Extensions (ADE)—on intraday charts. Designed for traders, it provides a clear framework to align with market ranges, avoid choppy price action, and stay out of overbought/oversold conditions, enhancing decision-making in dynamic markets.
Originality and Usefulness
"Teddy" uniquely combines DO, ADR High/Low, and ADE High/Low with dynamic percentage labels, while offering a concise view of price boundaries for daily Highs and Lows.
What It Does
Plots DO, ADR High/Low, and ADE High/Low as levels on the chart.
Labels each level with percentage distances from the current price (e.g., "ADRH (2.34%)").
Customizes visuals for clarity (colors, line styles, label sizes).
How It Works
Data Sources: Retrieves daily open and historical high/low data to compute ranges.
Calculations:
Daily Open (DO): Marks the session’s opening price.
ADR: Estimates typical daily range from past data, centered on DO to set High/Low bounds.
ADE: Extends ADR by a fixed percentage for outer limits.
Visualization: Updates lines and labels live, with user-defined colors, styles, and sizes.
How It Helps Traders
"Teddy" guides traders to avoid chasing markets in extended conditions:
Respecting the range: ADR High/Low define range-friendly zones—price above DO nearing ADR High signals bullish momentum is peaking, while below DO near ADR Low supports bearish momentum peaking.
Avoiding Choppy Conditions: Price lingering near DO often indicates indecision; "Teddy" highlights this level, helping you define balanced market conditions that favor choppy conditions.
Steering Clear of Overbought/Oversold: ADE High/Low mark extended levels where reversals are extremely—price hitting ADE Highlights the trend strength on the day but warns price is extremely over extended.
This structured approach keeps trades aligned with the markets average range, so traders can avoid extremes favorable levels for choppiness.
How to Use It
Apply to an intraday chart (e.g., SPY 5m).
Customize via inputs:
"Appearance Settings": Colors, line styles (Solid, Dotted, Dashed), widths (1-6), label visibility, and sizes (Tiny to Huge).
Watch levels: Consider reducing risk as the market approaches our ADRH/L levels. Trades can also play breakouts/failed breakouts at ADR High/Low or at ADE High/Low. Additionally remaining patient while the auction remains in balance near Day Open is an option as well.
Underlying Concepts
Range Dynamics: ADR reflects average daily volatility, DO anchors context, and ADE flags extensions.
Price Action: Levels highlight Volatility/Range (ADR) versus consolidation (DO) or expansive exhaustion (ADE).
Limitations
Optimized for day traders during live sessions; less effective in low-volatility periods.
Requires sufficient historical data for accurate ADR/ADE.
Levels are contextual and where I expect reactive price action to occur.. They are not guaranteed signals.
版本注释
Added a Volume ProfileUser Date input required. Levels then automate from there
Includes:
- Anchored Profile or an Option to make it fixed.
- Full Label and Color customization.
- Custom Labels for more user input context (notes)
- Background for Value included
Added PD High and PD High Levels
版本注释
- Auto update option added for Session Profiles (includes updating Previous Session High & Low)- Granularity improvements added to improve profile accuracy.
- Locked the profile to calculate based on the 5 minute time frame for consistency purposes regardless of the users time frame they are trading/studying on.
版本注释
- Bug fix so it auto plots the previous session how it should instead of todays session which it was doing.版本注释
- Removed Date selection to improve performance
- Previous Day's Range of Value is now fully Automated
版本注释
- Fixed PDH/PDL loading issue once the session begins- Improved Accuracy of ADR and Value levels
版本注释
Reverted back to the previous version due to the prior update causing levels to miscalculate版本注释
Added Monthly and Weekly VWAPSRemoved Previous Session's range of value
Removed Previous day High and Low
仅限邀请脚本
只有作者授权的用户才能访问此脚本。您需要申请并获得使用许可。通常情况下,付款后即可获得许可。更多详情,请按照下方作者的说明操作,或直接联系ATMTrades。
TradingView不建议您付费购买或使用任何脚本,除非您完全信任其作者并了解其工作原理。您也可以在我们的社区脚本找到免费的开源替代方案。
作者的说明
Gain Access to this indicator here: https://whop.com/about-the-money/
ATMTRADES
免责声明
这些信息和出版物并非旨在提供,也不构成TradingView提供或认可的任何形式的财务、投资、交易或其他类型的建议或推荐。请阅读使用条款了解更多信息。