OPEN-SOURCE SCRIPT
Harmonic Moving Average Confluence with Cross Signals
Harmonic Moving Average Confluence with Cross Signals
Overview:
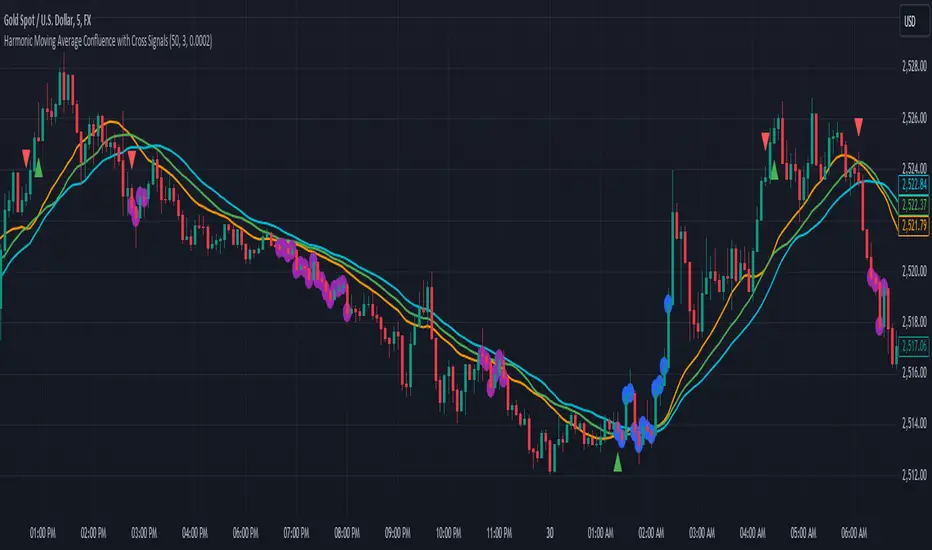
The "Harmonic Moving Average Confluence with Cross Signals" is a custom indicator designed to analyze harmonic moving averages and identify confluence zones on a chart. It provides insights into potential trading opportunities through cross signals and confluence detection.
Features:
Harmonic Moving Averages (HMAs):
38.2% HMA
50% HMA
61.8% HMA
These HMAs are calculated based on a base period and plotted on the chart to identify key support and resistance levels.
Cross Detection:
Buy Signal: Triggered when the 38.2% HMA crosses above the 50% HMA.
Sell Signal: Triggered when the 38.2% HMA crosses below the 50% HMA.
Buy signals are marked with green triangles below the candles.
Sell signals are marked with red triangles above the candles.
Confluence Detection:
Confluence zones are identified where two or more HMAs are within a specified percentage difference from each other.
Confluence Strength: Default minimum strength is set to 3.
Threshold Percentage: Default is set to 0.0002%.
Confluence zones are marked with blue circles on the chart, with 80% opacity.
Default Settings:
Base Period: 50
Minimum Confluence Strength: 3
Confluence Threshold: 0.0002%
Confluence Circles Opacity: 80%
How to Use It:
Setup:
Add the indicator to your trading chart.
The indicator will automatically calculate and plot the harmonic moving averages and detect cross signals and confluence zones based on the default settings.
Interpreting Signals:
Buy Signal: Look for green triangles below the candles indicating a potential buying opportunity when the 38.2% HMA crosses above the 50% HMA.
Sell Signal: Look for red triangles above the candles indicating a potential selling opportunity when the 38.2% HMA crosses below the 50% HMA.
Confluence Zones: Blue circles represent areas where two or more HMAs are within the specified threshold percentage, indicating potential trading zones.
Adjusting Parameters:
Base Period: Adjust to change the period of the moving averages if needed.
Minimum Confluence Strength: Set to control how many confluence zones need to be present to display a circle.
Threshold Percentage: Set to adjust the sensitivity of confluence detection.
Usage Tips:
Use the signals in conjunction with other technical analysis tools to enhance your trading strategy.
Monitor confluence zones for possible high-interest trading opportunities.
I hope this version aligns better with your needs. If there's anything specific you'd like to adjust or add, just let me know!
Overview:
The "Harmonic Moving Average Confluence with Cross Signals" is a custom indicator designed to analyze harmonic moving averages and identify confluence zones on a chart. It provides insights into potential trading opportunities through cross signals and confluence detection.
Features:
Harmonic Moving Averages (HMAs):
38.2% HMA
50% HMA
61.8% HMA
These HMAs are calculated based on a base period and plotted on the chart to identify key support and resistance levels.
Cross Detection:
Buy Signal: Triggered when the 38.2% HMA crosses above the 50% HMA.
Sell Signal: Triggered when the 38.2% HMA crosses below the 50% HMA.
Buy signals are marked with green triangles below the candles.
Sell signals are marked with red triangles above the candles.
Confluence Detection:
Confluence zones are identified where two or more HMAs are within a specified percentage difference from each other.
Confluence Strength: Default minimum strength is set to 3.
Threshold Percentage: Default is set to 0.0002%.
Confluence zones are marked with blue circles on the chart, with 80% opacity.
Default Settings:
Base Period: 50
Minimum Confluence Strength: 3
Confluence Threshold: 0.0002%
Confluence Circles Opacity: 80%
How to Use It:
Setup:
Add the indicator to your trading chart.
The indicator will automatically calculate and plot the harmonic moving averages and detect cross signals and confluence zones based on the default settings.
Interpreting Signals:
Buy Signal: Look for green triangles below the candles indicating a potential buying opportunity when the 38.2% HMA crosses above the 50% HMA.
Sell Signal: Look for red triangles above the candles indicating a potential selling opportunity when the 38.2% HMA crosses below the 50% HMA.
Confluence Zones: Blue circles represent areas where two or more HMAs are within the specified threshold percentage, indicating potential trading zones.
Adjusting Parameters:
Base Period: Adjust to change the period of the moving averages if needed.
Minimum Confluence Strength: Set to control how many confluence zones need to be present to display a circle.
Threshold Percentage: Set to adjust the sensitivity of confluence detection.
Usage Tips:
Use the signals in conjunction with other technical analysis tools to enhance your trading strategy.
Monitor confluence zones for possible high-interest trading opportunities.
I hope this version aligns better with your needs. If there's anything specific you'd like to adjust or add, just let me know!
开源脚本
秉承TradingView的精神,该脚本的作者将其开源,以便交易者可以查看和验证其功能。向作者致敬!您可以免费使用该脚本,但请记住,重新发布代码须遵守我们的网站规则。
免责声明
这些信息和出版物并非旨在提供,也不构成TradingView提供或认可的任何形式的财务、投资、交易或其他类型的建议或推荐。请阅读使用条款了解更多信息。
开源脚本
秉承TradingView的精神,该脚本的作者将其开源,以便交易者可以查看和验证其功能。向作者致敬!您可以免费使用该脚本,但请记住,重新发布代码须遵守我们的网站规则。
免责声明
这些信息和出版物并非旨在提供,也不构成TradingView提供或认可的任何形式的财务、投资、交易或其他类型的建议或推荐。请阅读使用条款了解更多信息。