OPEN-SOURCE SCRIPT
已更新 MNQ/NQ Rotations [Tiestobob]
### Indicator Description: MNQ/NQ Rotations [Tiestobob]
TO BE USED ONLY ON THE CONTINOUS CONTRACTS NQ1! and MNQ1! It will not work on others or the forward contracts of these.
#### Overview
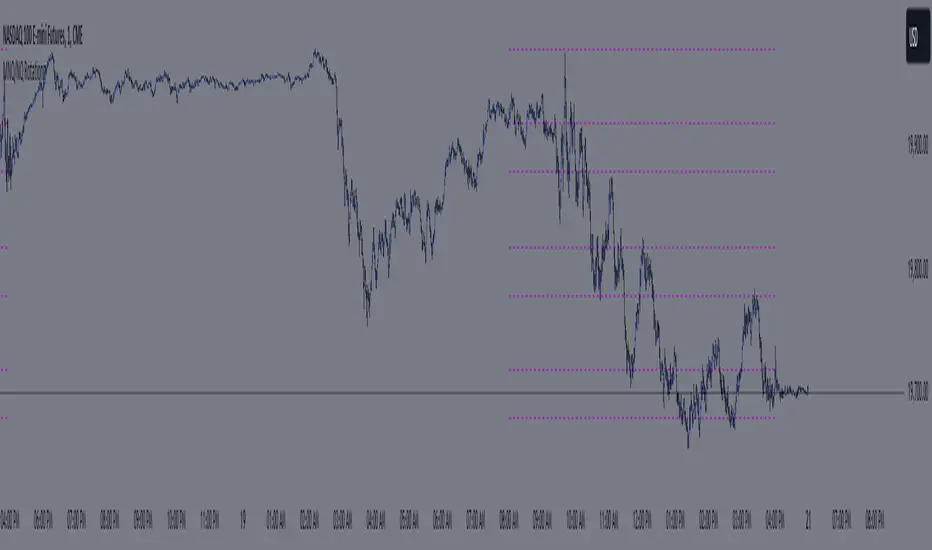
The MNQ/NQ Rotations indicator is designed for traders of Nasdaq futures (MNQ and NQ) to visualize key price levels where typical market rotations occur. This indicator identifies and highlights the xxx.20 and xxx.80 levels based on empirical data and trading experience, allowing traders to recognize potential support and resistance points during trading sessions.
#### Key Features
- **Timeframe Selection**: The indicator allows users to specify a timeframe for identifying breakout candles, ensuring flexibility across different trading strategies.
- **Active Trading Range**: Users can define an active trading range, focusing the analysis on specific hours when the market is most active.
- **Visual Representation**: The indicator paints horizontal lines at key price levels (xxx.20 and xxx.80), extending them across a user-defined length to aid in visual analysis.
- **Customization**: Users can customize the color of the lines to match their charting preferences.
#### Inputs
- **Timeframe (`tf`)**: Defines the timeframe to select the breakout candle (default: 1 minute).
- **Active Trading Range (`session`)**: Specifies the time range for identifying breakout candles (default: 08:00-12:00).
- **Line Color (`line_color`)**: Allows customization of the line color (default: purple).
#### Logic
1. **Session Validation**: The indicator checks if the current bar falls within the specified active trading range.
2. **Price Point Calculation**: For each candle close, the indicator calculates the nearest xxx.20 and xxx.80 levels.
3. **Line Drawing**: Horizontal lines are drawn at these key levels, extending a specified length forward to highlight potential rotation points.
#### Use Cases
- **Support and Resistance Identification**: By highlighting the xxx.20 and xxx.80 levels, traders can easily spot areas where the market is likely to reverse or consolidate.
- **Breakout Trading**: Traders can use the indicator to identify breakout levels and set appropriate entry points.
- **Risk Management**: The visual cues provided by the indicator can help traders set more effective stop-loss and take-profit levels.
#### Example
A trader using a 1-minute timeframe with an active trading range from 08:00 to 12:00 will see horizontal lines painted at the nearest xxx.20 and xxx.80 levels for each candle close during this period. These lines serve as visual markers for typical rotation points, aiding in decision-making and trade planning.
#### Conclusion
The MNQ/NQ Rotations indicator is a powerful tool for traders looking to enhance their market analysis of Nasdaq futures. By focusing on empirically derived rotation levels, this indicator provides clear visual cues for identifying key price levels, supporting more informed trading decisions.
TO BE USED ONLY ON THE CONTINOUS CONTRACTS NQ1! and MNQ1! It will not work on others or the forward contracts of these.
#### Overview
The MNQ/NQ Rotations indicator is designed for traders of Nasdaq futures (MNQ and NQ) to visualize key price levels where typical market rotations occur. This indicator identifies and highlights the xxx.20 and xxx.80 levels based on empirical data and trading experience, allowing traders to recognize potential support and resistance points during trading sessions.
#### Key Features
- **Timeframe Selection**: The indicator allows users to specify a timeframe for identifying breakout candles, ensuring flexibility across different trading strategies.
- **Active Trading Range**: Users can define an active trading range, focusing the analysis on specific hours when the market is most active.
- **Visual Representation**: The indicator paints horizontal lines at key price levels (xxx.20 and xxx.80), extending them across a user-defined length to aid in visual analysis.
- **Customization**: Users can customize the color of the lines to match their charting preferences.
#### Inputs
- **Timeframe (`tf`)**: Defines the timeframe to select the breakout candle (default: 1 minute).
- **Active Trading Range (`session`)**: Specifies the time range for identifying breakout candles (default: 08:00-12:00).
- **Line Color (`line_color`)**: Allows customization of the line color (default: purple).
#### Logic
1. **Session Validation**: The indicator checks if the current bar falls within the specified active trading range.
2. **Price Point Calculation**: For each candle close, the indicator calculates the nearest xxx.20 and xxx.80 levels.
3. **Line Drawing**: Horizontal lines are drawn at these key levels, extending a specified length forward to highlight potential rotation points.
#### Use Cases
- **Support and Resistance Identification**: By highlighting the xxx.20 and xxx.80 levels, traders can easily spot areas where the market is likely to reverse or consolidate.
- **Breakout Trading**: Traders can use the indicator to identify breakout levels and set appropriate entry points.
- **Risk Management**: The visual cues provided by the indicator can help traders set more effective stop-loss and take-profit levels.
#### Example
A trader using a 1-minute timeframe with an active trading range from 08:00 to 12:00 will see horizontal lines painted at the nearest xxx.20 and xxx.80 levels for each candle close during this period. These lines serve as visual markers for typical rotation points, aiding in decision-making and trade planning.
#### Conclusion
The MNQ/NQ Rotations indicator is a powerful tool for traders looking to enhance their market analysis of Nasdaq futures. By focusing on empirically derived rotation levels, this indicator provides clear visual cues for identifying key price levels, supporting more informed trading decisions.
版本注释
Removed fluff开源脚本
本着TradingView的真正精神,此脚本的创建者将其开源,以便交易者可以查看和验证其功能。向作者致敬!虽然您可以免费使用它,但请记住,重新发布代码必须遵守我们的网站规则。
免责声明
这些信息和出版物并不意味着也不构成TradingView提供或认可的金融、投资、交易或其它类型的建议或背书。请在使用条款阅读更多信息。
开源脚本
本着TradingView的真正精神,此脚本的创建者将其开源,以便交易者可以查看和验证其功能。向作者致敬!虽然您可以免费使用它,但请记住,重新发布代码必须遵守我们的网站规则。
免责声明
这些信息和出版物并不意味着也不构成TradingView提供或认可的金融、投资、交易或其它类型的建议或背书。请在使用条款阅读更多信息。