INVITE-ONLY SCRIPT
HFX543

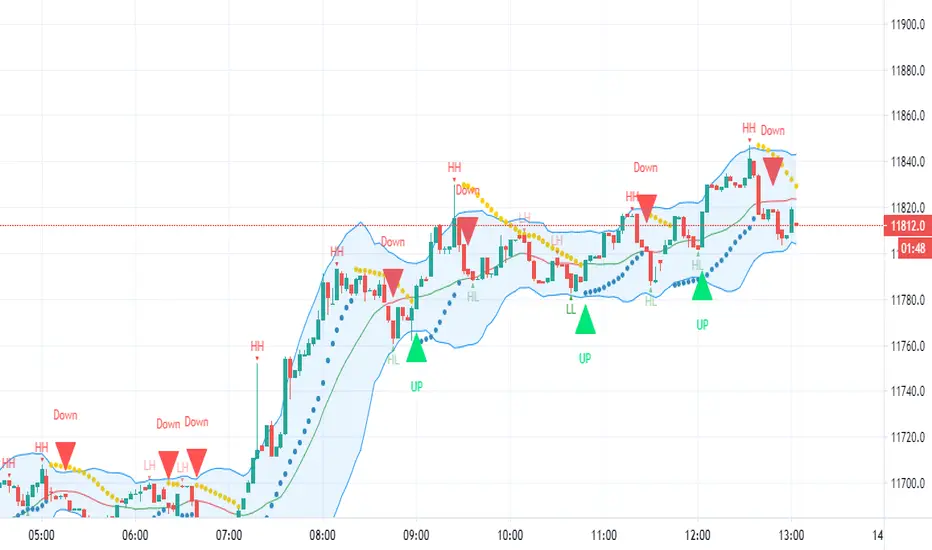
This indicator will provide the possibility of when trend reversals may happen on any time frame. It can work on any time frame and the use of Heiken Ashi candles can enhance it further.
When used with other indicators such as the MACD it can increase the possibility of a trend reversal being identified. On shorter time frames the alerts are much more frequent therefore can be less accurate so other indicators can be used.
It will show an alert Arrow for the First Flat BOTTOM Candle that has flipped on the PSAR and when the MACD has a crossover to the upside within one bar either side of the candle and those that are directly below the candle.
It will show an alert Arrow for the First Flat TOP HA Candle that has flipped on the PSAR + when the MACD has a crossover to the downside within one bar either side of the candle and those that are directly below the candle.
The Bollinger Bands have been added to enhance the possibility of a trend reversal occurring when the price reaches the Bollinger Band extremities and these should be paid attention to along with the Higher Highs (HH) and Lower Lows (LL).
The Colour changes on the Bollinger Band Moving Average from Red to Green to support a trend change possibility.
This has been designed to provide a visual confirmation that selected indicators have met certain criteria and that the trend has the possibility of reversing in the near future.
It is NOT meant to be a trading system or offer trading advice. The indicator offers only possibilities of trend reversals when the above criteria is met.
This is designed for Trend analysis ONLY.
To gain access to this invite only script, please send me a private message on Trading View so I can assist you further.
Thanks Les Gallagher
仅限邀请脚本
只有作者授权的用户才能访问此脚本。您需要申请并获得使用许可。通常情况下,付款后即可获得许可。更多详情,请按照下方作者的说明操作,或直接联系Lesgallagher247。
TradingView不建议您付费购买或使用任何脚本,除非您完全信任其作者并了解其工作原理。您也可以在我们的社区脚本找到免费的开源替代方案。
作者的说明
免责声明
这些信息和出版物并非旨在提供,也不构成TradingView提供或认可的任何形式的财务、投资、交易或其他类型的建议或推荐。请阅读使用条款了解更多信息。
仅限邀请脚本
只有作者授权的用户才能访问此脚本。您需要申请并获得使用许可。通常情况下,付款后即可获得许可。更多详情,请按照下方作者的说明操作,或直接联系Lesgallagher247。
TradingView不建议您付费购买或使用任何脚本,除非您完全信任其作者并了解其工作原理。您也可以在我们的社区脚本找到免费的开源替代方案。
作者的说明
免责声明
这些信息和出版物并非旨在提供,也不构成TradingView提供或认可的任何形式的财务、投资、交易或其他类型的建议或推荐。请阅读使用条款了解更多信息。