OPEN-SOURCE SCRIPT
ICT Market Structure and OTE Zone

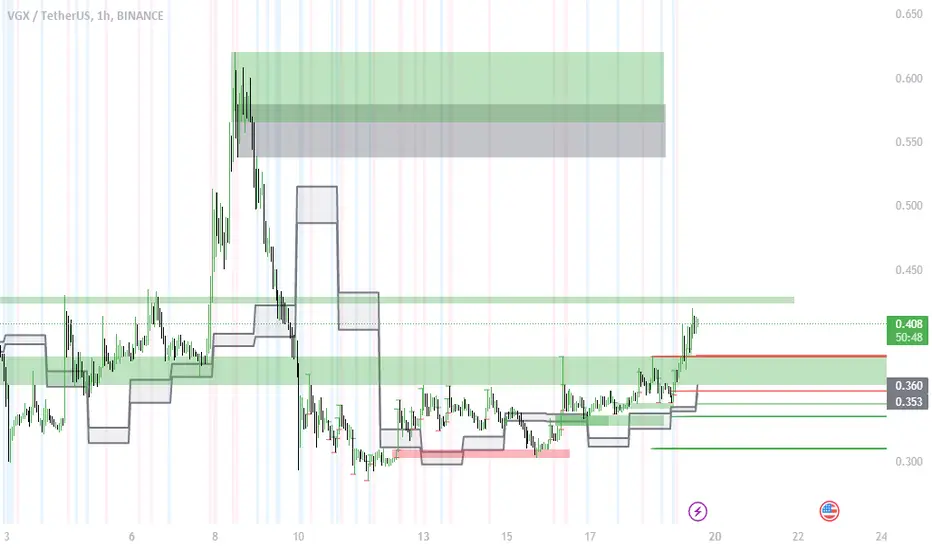
This indicator is based on the ICT (Inner Circle Trader) concepts, and it helps identify daily market structure and the optimal trade entry (OTE) zone based on Fibonacci retracement levels.
To read and interpret this indicator, follow these steps:
Daily High and Low: The red line represents the daily high, while the green line represents the daily low. These lines help you understand the market structure and the range within which the price has moved during the previous day.
OTE Zone: The gray area between two gray lines represents the optimal trade entry (OTE) zone. This zone is calculated using Fibonacci retracement levels (in this case, 61.8% and 78.6%) applied to the previous day's high and low. The OTE zone is an area where traders might expect a higher probability of a price reversal, following the ICT concepts.
To use this indicator for trading decisions, you should consider the following:
Identify the market structure and overall trend (uptrend, downtrend, or ranging).
Watch for price action to enter the OTE zone. When the price reaches the OTE zone, it may indicate a higher probability of a price reversal.
Combine the OTE zone with other confluences, such as support and resistance levels, candlestick patterns, or additional ICT concepts like order blocks and market maker profiles, to strengthen your trading decisions.
Always use proper risk management and stop-loss orders to protect your capital in case the market moves against your trade.
Keep in mind that the provided indicator is a simple example based on the ICT concepts and should not be considered financial advice. The ICT methodology is vast, and traders often combine multiple concepts to develop their trading strategies. The provided indicator should be treated as a starting point to explore and implement the ICT concepts in your trading strategy.
开源脚本
秉承TradingView的精神,该脚本的作者将其开源,以便交易者可以查看和验证其功能。向作者致敬!您可以免费使用该脚本,但请记住,重新发布代码须遵守我们的网站规则。
免责声明
这些信息和出版物并非旨在提供,也不构成TradingView提供或认可的任何形式的财务、投资、交易或其他类型的建议或推荐。请阅读使用条款了解更多信息。
开源脚本
秉承TradingView的精神,该脚本的作者将其开源,以便交易者可以查看和验证其功能。向作者致敬!您可以免费使用该脚本,但请记住,重新发布代码须遵守我们的网站规则。
免责声明
这些信息和出版物并非旨在提供,也不构成TradingView提供或认可的任何形式的财务、投资、交易或其他类型的建议或推荐。请阅读使用条款了解更多信息。