OPEN-SOURCE SCRIPT
ADX + DMI (HMA Version)
📝 Description (What This Indicator Does)
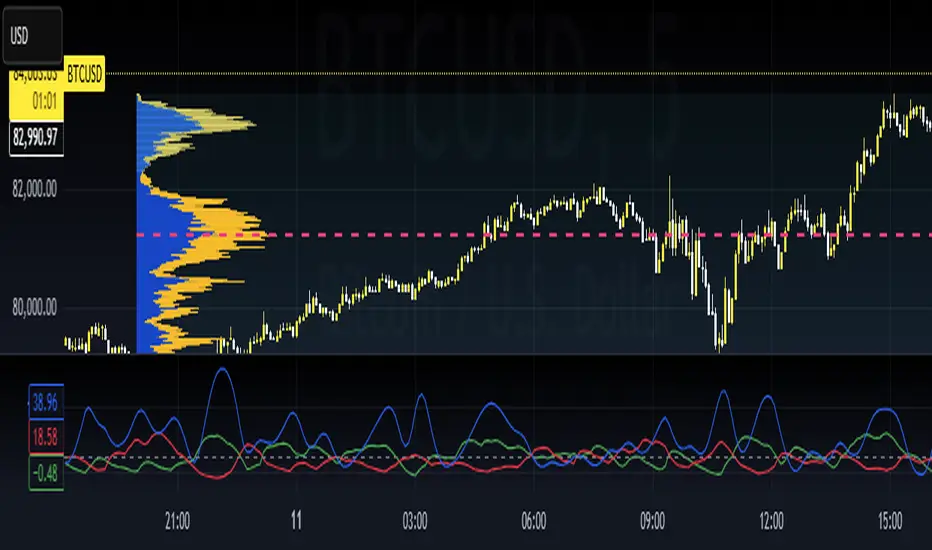
🚀 ADX + DMI (HMA Version) is a trend strength oscillator that enhances the traditional ADX by using the Hull Moving Average (HMA) instead of EMA.
✅ This results in a much faster and more responsive trend detection while filtering out choppy price action.
🎯 What This Indicator Does:
1️⃣ Measures Trend Strength – ADX shows when a trend is strong or weak.
2️⃣ Identifies Trend Direction – DI+ (Green) shows bullish momentum, DI- (Red) shows bearish momentum.
3️⃣ Uses Hull Moving Average (HMA) for Faster Signals – Removes lag and reacts faster to trend changes.
4️⃣ Reduces False Signals – Traditional ADX lags behind, but this version reacts quickly to reversals.
5️⃣ Good for Scalping & Day Trading – Especially for BTC 5-min and lower timeframes.
⚙ Indicator Inputs (Customization)
Input Name Example Value Purpose
ADX Length 14 Defines the smoothing for the ADX value.
DI Length 14 Defines how DI+ and DI- are calculated.
HMA Length 24 Hull Moving Average smoothing for ADX & DI+.
Trend Threshold 25 The level above which ADX confirms a strong trend.
📌 You can adjust these settings to optimize for different assets and timeframes.
🎯 Trading Rules & How to Use It
✅ How to Identify a Strong Trend:
When ADX (Blue Line) is above 25→ A strong trend is in play.
When ADX is below 25 → The market is choppy or ranging.
✅ How to Use DI+ and DI- for Trend Direction:
If DI+ (Green) is above DI- (Red), the market is in an uptrend.
If DI- (Red) is above DI+ (Green), the market is in a downtrend.
✅ How to Confirm Entries & Exits:
1️⃣ Enter Long when DI+ crosses above DI- while ADX is rising above 25.
2️⃣ Enter Short when DI- crosses above DI+ while ADX is rising above 25.
3️⃣ Avoid trading when ADX is below 25 – the market is in a choppy range.
This should not be used as a stand alone oscillator. Trading takes skill and is risky. Use at your own risk.
This is not advise on how to trade, these are just examples of how I use the oscillator. Trade at your own risk.
You can put this on your chart versus the tradingview adx and you can adjust the settings to see the difference. This was optimized for btc on the 5 min chart. You can adjust for your trading strategy.
开源脚本
秉承TradingView的精神,该脚本的作者将其开源,以便交易者可以查看和验证其功能。向作者致敬!您可以免费使用该脚本,但请记住,重新发布代码须遵守我们的网站规则。
免责声明
这些信息和出版物并非旨在提供,也不构成TradingView提供或认可的任何形式的财务、投资、交易或其他类型的建议或推荐。请阅读使用条款了解更多信息。
免责声明
这些信息和出版物并非旨在提供,也不构成TradingView提供或认可的任何形式的财务、投资、交易或其他类型的建议或推荐。请阅读使用条款了解更多信息。