OPEN-SOURCE SCRIPT
Largest Market Cap Performance

Hey guys,
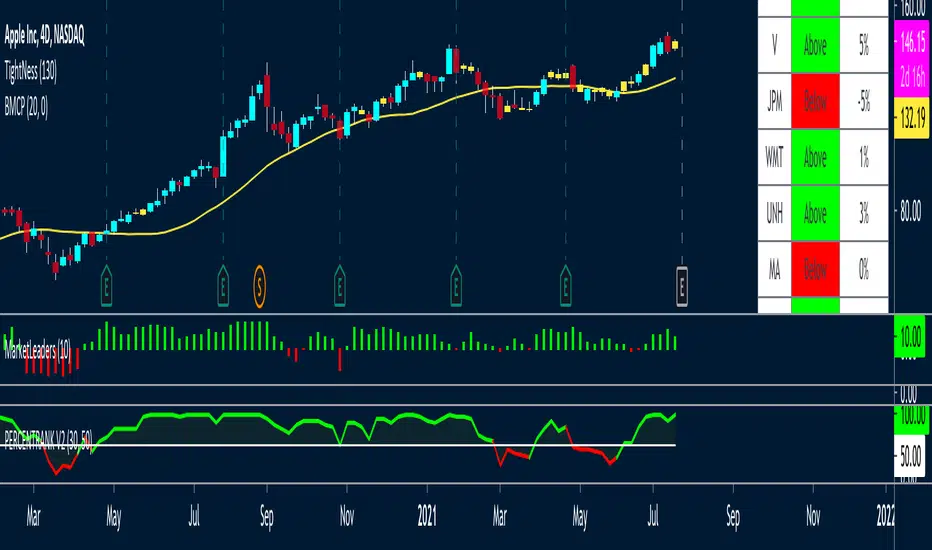
- This Table script imports the 20 largest market caps ticker data and creates a moving average to check if each is above their moving average or not.
- We all know how important these mega gargantuan compies are to the overall market. If they stall everything else stalls too.
- I also added a column to show how far these are above or below their moving averages, to see if things are overextended.
- This script is for the table only, but I also created a ribbon indicator showing at the bottom of the screen. I found this to be quite reliable and have built a strategy that trades these large caps based just on the ribbon.
- I will post that strat at some point in the future
开源脚本
秉承TradingView的精神,该脚本的作者将其开源,以便交易者可以查看和验证其功能。向作者致敬!您可以免费使用该脚本,但请记住,重新发布代码须遵守我们的网站规则。
免责声明
这些信息和出版物并非旨在提供,也不构成TradingView提供或认可的任何形式的财务、投资、交易或其他类型的建议或推荐。请阅读使用条款了解更多信息。
开源脚本
秉承TradingView的精神,该脚本的作者将其开源,以便交易者可以查看和验证其功能。向作者致敬!您可以免费使用该脚本,但请记住,重新发布代码须遵守我们的网站规则。
免责声明
这些信息和出版物并非旨在提供,也不构成TradingView提供或认可的任何形式的财务、投资、交易或其他类型的建议或推荐。请阅读使用条款了解更多信息。