OPEN-SOURCE SCRIPT
IKH Cloud V1.0 (nextSignals)
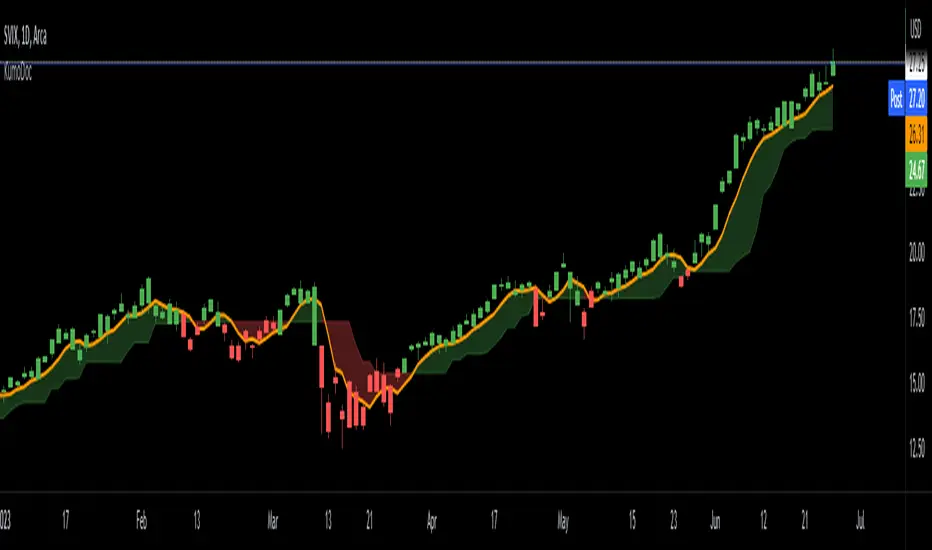
The IKH Cloud V1.0 (nextSignals) is an Ichomoku-type indicator that can be used for various trading strategies. It's based on a ThinkScript study from @stephenharlinmd (aka nextSignals) that uses an instantaneous moving average as the base MA, and a custom trailing stop. Both of these components form the cloud.
Indicator Components and Calculation
The indicator comprises two key components:
These two components are used to create a filled area on the chart, also known as the 'cloud'. The color of the cloud and the candlesticks change based on the relative positions of the IMA and the trailing stop.
How to Use the Indicator
The following are just ideas on how to use this indicator, and is not financial advice in any form:
Please don't use just this indicator on its own. Please use this in conjunction with other analysis tools, indicators, and systems you already have in place. Always consider the overall market context and use appropriate risk management strategies.
Indicator Components and Calculation
The indicator comprises two key components:
- Instantaneous Moving Average (IMA): This is a type of moving average that places a greater weight on the most recent data points, and is based on Ehler's book "Rocket Science for Traders". This is slightly different from the Doc's original, but is very approximate.
- Trailing Stop: This component helps determine the stop loss level that moves along with the price. The trailing stop is based on the highest high and the lowest low of the last 5 bars, as well as the simple moving averages of the low and high of the previous bar. The trailing stop is calculated separately for each condition: when the bar index is greater than 1 and when the previous 'a' variable is either 1 or 0.
These two components are used to create a filled area on the chart, also known as the 'cloud'. The color of the cloud and the candlesticks change based on the relative positions of the IMA and the trailing stop.
How to Use the Indicator
The following are just ideas on how to use this indicator, and is not financial advice in any form:
- Trend Identification: When the IMA is above the trailing stop (cloud), it indicates an uptrend, and when it's below, it indicates a downtrend.
- Entry/Exit Signals: Traders can consider going long when the candlesticks move above the cloud and short when they move below the cloud.
- Stop Loss Level: The trailing stop line (the cloud's edge) can serve as a dynamic stop loss level.
Please don't use just this indicator on its own. Please use this in conjunction with other analysis tools, indicators, and systems you already have in place. Always consider the overall market context and use appropriate risk management strategies.
开源脚本
秉承TradingView的精神,该脚本的作者将其开源,以便交易者可以查看和验证其功能。向作者致敬!您可以免费使用该脚本,但请记住,重新发布代码须遵守我们的网站规则。
免责声明
这些信息和出版物并非旨在提供,也不构成TradingView提供或认可的任何形式的财务、投资、交易或其他类型的建议或推荐。请阅读使用条款了解更多信息。
开源脚本
秉承TradingView的精神,该脚本的作者将其开源,以便交易者可以查看和验证其功能。向作者致敬!您可以免费使用该脚本,但请记住,重新发布代码须遵守我们的网站规则。
免责声明
这些信息和出版物并非旨在提供,也不构成TradingView提供或认可的任何形式的财务、投资、交易或其他类型的建议或推荐。请阅读使用条款了解更多信息。