INVITE-ONLY SCRIPT
已更新 Aspen Trading S/R Levels v2
In Trading, Objectivity Trumps Subjectivity
“Every trader is a steaming hot bowl of bias stew and must maintain self-awareness and lucidity behind the screens as the trading day oscillates between boredom and terror.”
The above quote is from a good friend of mine and veteran FX trader Brent Donnelly. It completely nails the biggest challenge for new and even experienced traders: being as objective as possible when making trading decisions.
Yes, as you become more experienced, subjectivity, market feel and experience are part of one’s decision-making matrix, but early on you do not have that luxury.
If you start each day knowing that price action in the market is random it will remind you to think objectively. There are, however, repeatable patterns that occur again and again…..it’s your job to identify them.
That’s where Support & Resistance levels come in.
Definitions: “Support” and “Resistance” Levels
Many technical indicators and tools can be subjective and challenging to learn. This is not the case with support and resistance levels.
Support and resistance are terms for two price levels on a chart that appear to limit the security’s range of movement.
The “support level” is where the price regularly stops falling and bounces up.
The “resistance level” is where the price normally stops rising and dips back down.
The more frequently a price hits either level, the more reliable that level is likely to be in predicting future price movements.
Understanding Support and Resistance Levels
Remember, the more informed and objective we can be with numbers, the more confident we can be with our trades. That’s important because, although price action is random (a fact that has been proven time and time again), there are repeatable patterns we can use to get an edge.
Two of those objective data points we can use to gain an edge are support and resistance levels. These are two of the best tools we have when it comes to swing trading. Why? Because they give us strong data points that suggest where an instrument is likely (and unlikely) to go.
But this is really key: Arbitrarily cataloging each price level that appears to be relevant as a support or resistance level isn’t going to get you far. That’s why Aspen Trading takes a unique approach to support and resistance levels.
With Aspen’s Support & Resistance Levels, we measure where trades (prices) occur in terms of frequency. This gives us a sense of where market participants are wagering prices may go.
That’s about as raw and unfiltered as you can get in terms of displaying what has taken place. There’s no room for interpretation - this is raw data that can be used to get a sense of where prices may be heading.
Learning The “Four Sets” of Support and Resistance Levels
There are four sets of support and resistance levels that are part of Aspen Trading’s S/R framework.
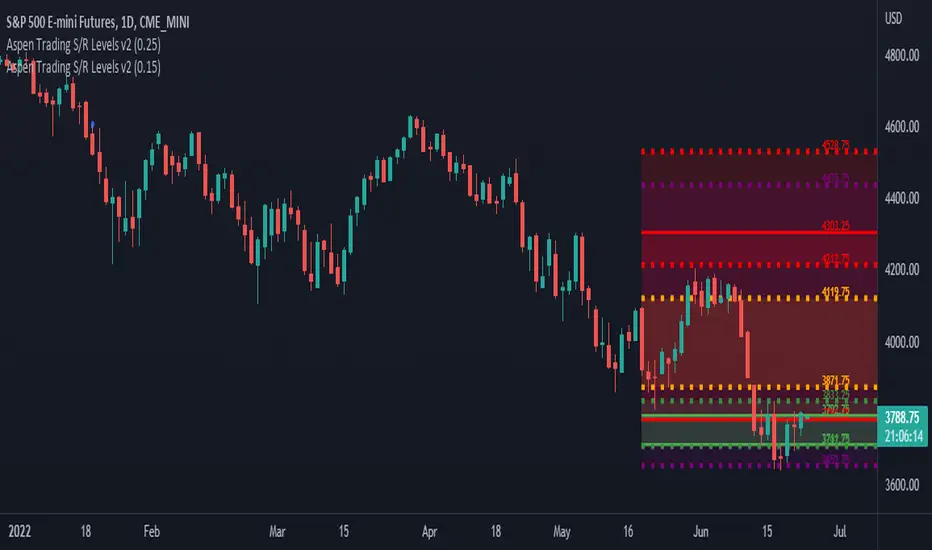
Each set of support and resistance levels is unique to a specified period of time. We display each of them in different colors on our charts when we analyze trades to make it easy for us to understand the data as we get comfortable reading charts.
You’ll see each of these levels on display in the charts that follow below. The four sets of support and resistance levels are classified as follows:
There are four sets of support and resistance levels that are displayed by Aspen Trading’s S/R Analysis Tool. Each one is unique to a specified period of time that we then display directly on the chart. The levels are classified as follows
GREEN: displays 2 dotted lines (upper/lower)
ORANGE: displays 2 dotted lines (upper/lower)
RED: displays 2 dotted lines (upper/lower)
PURPLE: displays 2 dotted lines (upper/lower)
IMPORTANT:
What’s the distinction between the 4 color levels?
Essentially think of these levels on a rising scale of importance. While GREEN levels are certainly key, they do not hold the same level of significance as the PURPLE levels.
To get access to Aspen's S/R Levels - simply purchase an annual license for $595 at the link below. Once the transaction is complete, we will email you asking you for your TradingView username and get you permisisoned within 12-hours.
“Every trader is a steaming hot bowl of bias stew and must maintain self-awareness and lucidity behind the screens as the trading day oscillates between boredom and terror.”
The above quote is from a good friend of mine and veteran FX trader Brent Donnelly. It completely nails the biggest challenge for new and even experienced traders: being as objective as possible when making trading decisions.
Yes, as you become more experienced, subjectivity, market feel and experience are part of one’s decision-making matrix, but early on you do not have that luxury.
If you start each day knowing that price action in the market is random it will remind you to think objectively. There are, however, repeatable patterns that occur again and again…..it’s your job to identify them.
That’s where Support & Resistance levels come in.
Definitions: “Support” and “Resistance” Levels
Many technical indicators and tools can be subjective and challenging to learn. This is not the case with support and resistance levels.
Support and resistance are terms for two price levels on a chart that appear to limit the security’s range of movement.
The “support level” is where the price regularly stops falling and bounces up.
The “resistance level” is where the price normally stops rising and dips back down.
The more frequently a price hits either level, the more reliable that level is likely to be in predicting future price movements.
Understanding Support and Resistance Levels
Remember, the more informed and objective we can be with numbers, the more confident we can be with our trades. That’s important because, although price action is random (a fact that has been proven time and time again), there are repeatable patterns we can use to get an edge.
Two of those objective data points we can use to gain an edge are support and resistance levels. These are two of the best tools we have when it comes to swing trading. Why? Because they give us strong data points that suggest where an instrument is likely (and unlikely) to go.
But this is really key: Arbitrarily cataloging each price level that appears to be relevant as a support or resistance level isn’t going to get you far. That’s why Aspen Trading takes a unique approach to support and resistance levels.
With Aspen’s Support & Resistance Levels, we measure where trades (prices) occur in terms of frequency. This gives us a sense of where market participants are wagering prices may go.
That’s about as raw and unfiltered as you can get in terms of displaying what has taken place. There’s no room for interpretation - this is raw data that can be used to get a sense of where prices may be heading.
Learning The “Four Sets” of Support and Resistance Levels
There are four sets of support and resistance levels that are part of Aspen Trading’s S/R framework.
Each set of support and resistance levels is unique to a specified period of time. We display each of them in different colors on our charts when we analyze trades to make it easy for us to understand the data as we get comfortable reading charts.
You’ll see each of these levels on display in the charts that follow below. The four sets of support and resistance levels are classified as follows:
There are four sets of support and resistance levels that are displayed by Aspen Trading’s S/R Analysis Tool. Each one is unique to a specified period of time that we then display directly on the chart. The levels are classified as follows
GREEN: displays 2 dotted lines (upper/lower)
ORANGE: displays 2 dotted lines (upper/lower)
RED: displays 2 dotted lines (upper/lower)
PURPLE: displays 2 dotted lines (upper/lower)
IMPORTANT:
What’s the distinction between the 4 color levels?
Essentially think of these levels on a rising scale of importance. While GREEN levels are certainly key, they do not hold the same level of significance as the PURPLE levels.
To get access to Aspen's S/R Levels - simply purchase an annual license for $595 at the link below. Once the transaction is complete, we will email you asking you for your TradingView username and get you permisisoned within 12-hours.
版本注释
In Trading, Objectivity Trumps Subjectivity“Every trader is a steaming hot bowl of bias stew and must maintain self-awareness and lucidity behind the screens as the trading day oscillates between boredom and terror.”
The above quote is from a good friend of mine and veteran FX trader Brent Donnelly. It completely nails the biggest challenge for new and even experienced traders: being as objective as possible when making trading decisions.
Yes, as you become more experienced, subjectivity, market feel and experience are part of one’s decision-making matrix, but early on you do not have that luxury.
If you start each day knowing that price action in the market is random it will remind you to think objectively. There are, however, repeatable patterns that occur again and again…..it’s your job to identify them.
That’s where Support & Resistance levels come in.
Definitions: “Support” and “Resistance” Levels
Many technical indicators and tools can be subjective and challenging to learn. This is not the case with support and resistance levels.
Support and resistance are terms for two price levels on a chart that appear to limit the security’s range of movement.
The “support level” is where the price regularly stops falling and bounces up.
The “resistance level” is where the price normally stops rising and dips back down.
The more frequently a price hits either level, the more reliable that level is likely to be in predicting future price movements.
Understanding Support and Resistance Levels
Remember, the more informed and objective we can be with numbers, the more confident we can be with our trades. That’s important because, although price action is random (a fact that has been proven time and time again), there are repeatable patterns we can use to get an edge.
Two of those objective data points we can use to gain an edge are support and resistance levels. These are two of the best tools we have when it comes to swing trading. Why? Because they give us strong data points that suggest where an instrument is likely (and unlikely) to go.
But this is really key: Arbitrarily cataloging each price level that appears to be relevant as a support or resistance level isn’t going to get you far. That’s why Aspen Trading takes a unique approach to support and resistance levels.
With Aspen’s Support & Resistance Levels, we measure where trades (prices) occur in terms of frequency. This gives us a sense of where market participants are wagering prices may go.
That’s about as raw and unfiltered as you can get in terms of displaying what has taken place. There’s no room for interpretation - this is raw data that can be used to get a sense of where prices may be heading.
Learning The “Four Sets” of Support and Resistance Levels
There are four sets of support and resistance levels that are part of Aspen Trading’s S/R framework.
Each set of support and resistance levels is unique to a specified period of time. We display each of them in different colors on our charts when we analyze trades to make it easy for us to understand the data as we get comfortable reading charts.
You’ll see each of these levels on display in the charts that follow below. The four sets of support and resistance levels are classified as follows:
There are four sets of support and resistance levels that are displayed by Aspen Trading’s S/R Analysis Tool. Each one is unique to a specified period of time that we then display directly on the chart. The levels are classified as follows
GREEN: displays 2 dotted lines (upper/lower)
ORANGE: displays 2 dotted lines (upper/lower)
RED: displays 2 dotted lines (upper/lower)
PURPLE: displays 2 dotted lines (upper/lower)
IMPORTANT:
What’s the distinction between the 4 color levels?
Essentially think of these levels on a rising scale of importance. While GREEN levels are certainly key, they do not hold the same level of significance as the PURPLE levels.
To get access to Aspen's S/R Levels - simply purchase an annual license for $595 at the link below. Once the transaction is complete, we will email you asking you for your TradingView username and get you permisisoned within 12-hours.
仅限邀请脚本
只有作者授权的用户才能访问此脚本。您需要申请并获得使用许可。通常情况下,付款后即可获得许可。更多详情,请按照下方作者的说明操作,或直接联系AspenTrading。
TradingView不建议您付费购买或使用任何脚本,除非您完全信任其作者并了解其工作原理。您也可以在我们的社区脚本找到免费的开源替代方案。
作者的说明
Drop me an email at dave@aspentrading.com
免责声明
这些信息和出版物并非旨在提供,也不构成TradingView提供或认可的任何形式的财务、投资、交易或其他类型的建议或推荐。请阅读使用条款了解更多信息。
仅限邀请脚本
只有作者授权的用户才能访问此脚本。您需要申请并获得使用许可。通常情况下,付款后即可获得许可。更多详情,请按照下方作者的说明操作,或直接联系AspenTrading。
TradingView不建议您付费购买或使用任何脚本,除非您完全信任其作者并了解其工作原理。您也可以在我们的社区脚本找到免费的开源替代方案。
作者的说明
Drop me an email at dave@aspentrading.com
免责声明
这些信息和出版物并非旨在提供,也不构成TradingView提供或认可的任何形式的财务、投资、交易或其他类型的建议或推荐。请阅读使用条款了解更多信息。