OPEN-SOURCE SCRIPT
Global M2 Money Supply (USD) Growth

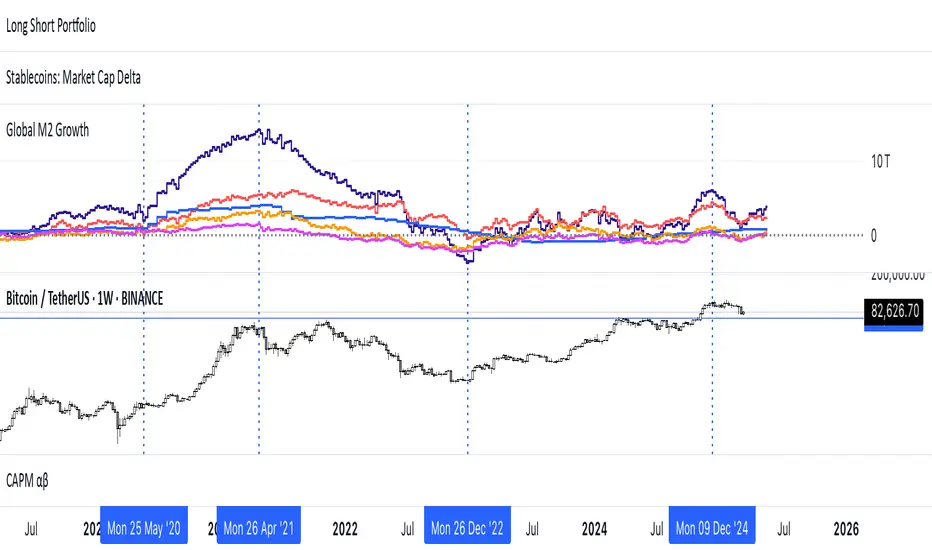
The Global M2 Growth indicator evaluates the total liquid money supply, including cash, checking deposits, and assets that can be easily converted to cash. It reflects changes in global liquidity by tracking year-on-year (YoY) changes in the Global M2 money supply rather than its absolute value. This approach highlights the velocity of liquidity expansion or contraction, offering a clearer understanding of its correlation with asset performance, such as Bitcoin.
How It Works
When the Global M2 money supply expands, it reflects an increase in available liquidity. This often leads to an influx of capital into higher-yielding and riskier assets like Bitcoin, equities, and commodities. Conversely, when M2 contracts, liquidity tightens, leading to declines in the values of these assets.
An essential insight is that Bitcoin's price is not immediately affected by changes in M2. Research shows a lag of approximately 56-60 days (around two months) between liquidity changes and Bitcoin's price movements. Shifting the liquidity data forward by this period improves the correlation between Global M2 and Bitcoin performance.
How to Use
Track Global M2 YoY Change: Focus on liquidity's yearly change to identify trends. Rapid increases in liquidity often signify favorable conditions for Bitcoin and other risk assets to rise, while contractions often predict price declines or consolidation phases.
Account for the Lag Effect: Incorporate the two-month lag into your analysis to predict Bitcoin's potential moves more accurately. For instance, a recent resurgence in liquidity growth could signal a Bitcoin rally within the next two months.
Use as a Macro Indicator: Monitor liquidity trends alongside other economic indicators and asset performance metrics to build a more comprehensive investment framework.
By tracking these dynamics, traders and investors can better anticipate Bitcoin's trajectory and make informed decisions.
开源脚本
秉承TradingView的精神,该脚本的作者将其开源,以便交易者可以查看和验证其功能。向作者致敬!您可以免费使用该脚本,但请记住,重新发布代码须遵守我们的网站规则。
免责声明
这些信息和出版物并非旨在提供,也不构成TradingView提供或认可的任何形式的财务、投资、交易或其他类型的建议或推荐。请阅读使用条款了解更多信息。
开源脚本
秉承TradingView的精神,该脚本的作者将其开源,以便交易者可以查看和验证其功能。向作者致敬!您可以免费使用该脚本,但请记住,重新发布代码须遵守我们的网站规则。
免责声明
这些信息和出版物并非旨在提供,也不构成TradingView提供或认可的任何形式的财务、投资、交易或其他类型的建议或推荐。请阅读使用条款了解更多信息。