INVITE-ONLY SCRIPT
已更新 |AG| Heiken Ashi Scanner

|AG| Heiken Ashi Scanner
Heiken Ashi shares some characteristics with standard candlestick charts but differs
based on the values used to create each candle.
Instead of using the open, high, low, and close like standard candlestick charts,
the Heikin-Ashi technique uses a modified formula based on two-period averages.
This gives the chart a smoother appearance, making it easier to spots trends and reversals,
but also obscures gaps and some price data.
Heikin Ashi in my perspective is one of the best trend detectors in long term scenarios.
The use of Heiken Ashi Smoothed could be determined by the use of a moving average.
The use of Smoothed with Simple, Exponential, and Hull Moving Average are included in this script.
Script Explanation:
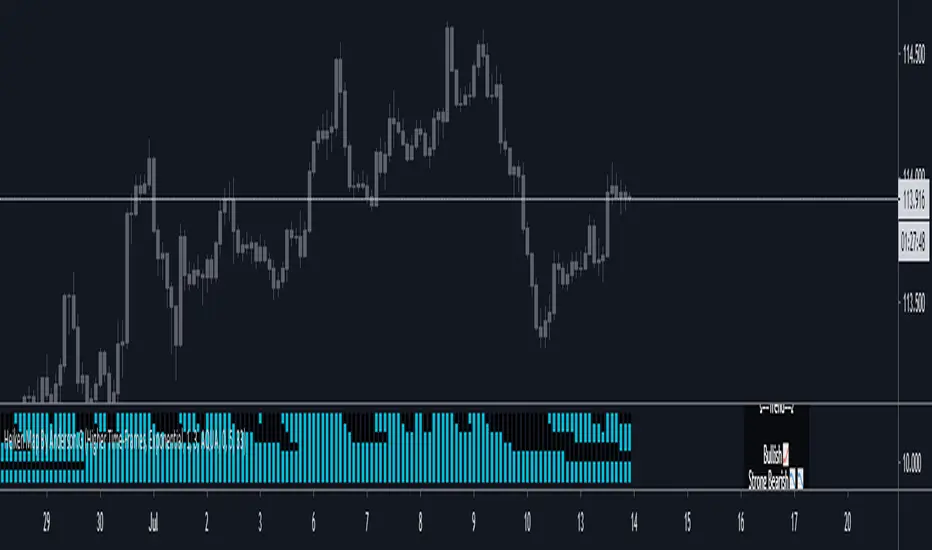
This Script is going to plot us different Heikin Ashi when they are up ( Bullish ) is going to be colored.
7 different Time-Frames are going to be taken into account.
Also is possible to modify the Length Setting and the MA calculation.
Setting Options:
↪Scanner TIME:
↪This Script (Scanner) is going to show us different Heiken Ashi Time-Frames
↪7 in total.
↪Higher Time-Frames
60 - 120 - 240 - 480 - 1D - 3D -1W
↪Lower Time-Frames
1 - 5- 15 -30 -60 - 120 -240
↪Smoothed?:
↪Select Turn On/Turn Off
↪Is going to select or deselect Smoothed Heiken A. or change in base our configuration.
↪Select Type:
↪This option let us select between:
↪ Exponential and Hull Moving Average.
↪Length Options
↪Length 1
↪Length 2
↪ In EMA and SMA I prefer 1:3 and 1:5
↪And In Hull MA. I prefer 10:1
↪Design Settings
↪Color Options
↪ U can select different color options.
↪ My Favorites are Orange, Aqua, and Purple.
↪Transparency
↪Set Transparency 0 is 100% visible and 100 is invisible.
↪LineWidth (defval= 5)
↪Set the thickness
↪Show Information Panel
↪ We are going to have a little informative panel in the right so we could
have a quick look at the trend.
↪Panel Position Offset (defval= 33)
Examples Of Color Options:


Examples Of Configurations:


Heiken Ashi shares some characteristics with standard candlestick charts but differs
based on the values used to create each candle.
Instead of using the open, high, low, and close like standard candlestick charts,
the Heikin-Ashi technique uses a modified formula based on two-period averages.
This gives the chart a smoother appearance, making it easier to spots trends and reversals,
but also obscures gaps and some price data.
Heikin Ashi in my perspective is one of the best trend detectors in long term scenarios.
The use of Heiken Ashi Smoothed could be determined by the use of a moving average.
The use of Smoothed with Simple, Exponential, and Hull Moving Average are included in this script.
Script Explanation:
This Script is going to plot us different Heikin Ashi when they are up ( Bullish ) is going to be colored.
7 different Time-Frames are going to be taken into account.
Also is possible to modify the Length Setting and the MA calculation.
Setting Options:
↪Scanner TIME:
↪This Script (Scanner) is going to show us different Heiken Ashi Time-Frames
↪7 in total.
↪Higher Time-Frames
60 - 120 - 240 - 480 - 1D - 3D -1W
↪Lower Time-Frames
1 - 5- 15 -30 -60 - 120 -240
↪Smoothed?:
↪Select Turn On/Turn Off
↪Is going to select or deselect Smoothed Heiken A. or change in base our configuration.
↪Select Type:
↪This option let us select between:
↪ Exponential and Hull Moving Average.
↪Length Options
↪Length 1
↪Length 2
↪ In EMA and SMA I prefer 1:3 and 1:5
↪And In Hull MA. I prefer 10:1
↪Design Settings
↪Color Options
↪ U can select different color options.
↪ My Favorites are Orange, Aqua, and Purple.
↪Transparency
↪Set Transparency 0 is 100% visible and 100 is invisible.
↪LineWidth (defval= 5)
↪Set the thickness
↪Show Information Panel
↪ We are going to have a little informative panel in the right so we could
have a quick look at the trend.
↪Panel Position Offset (defval= 33)
Examples Of Color Options:
Examples Of Configurations:
版本注释
Please PM me on Trading View For Access版本注释
Fixing code 版本注释
Adding Alert Options:For the following Conditions:
"Strong Bullish📈📈"
"Bullish📈"
"Weak Bullish📈📉"
"ALL Is Bearish📉📉😱"
"Strong Bearish📉📉"
"Bearish📉"
"Weak Bearish📈📉"
"All Is Bullish📈📈😱"
仅限邀请脚本
只有作者授权的用户才能访问此脚本。您需要申请并获得使用许可。通常情况下,付款后即可获得许可。更多详情,请按照下方作者的说明操作,或直接联系Anderson-FX。
TradingView不建议您付费购买或使用任何脚本,除非您完全信任其作者并了解其工作原理。您也可以在我们的社区脚本找到免费的开源替代方案。
作者的说明
免责声明
这些信息和出版物并非旨在提供,也不构成TradingView提供或认可的任何形式的财务、投资、交易或其他类型的建议或推荐。请阅读使用条款了解更多信息。
仅限邀请脚本
只有作者授权的用户才能访问此脚本。您需要申请并获得使用许可。通常情况下,付款后即可获得许可。更多详情,请按照下方作者的说明操作,或直接联系Anderson-FX。
TradingView不建议您付费购买或使用任何脚本,除非您完全信任其作者并了解其工作原理。您也可以在我们的社区脚本找到免费的开源替代方案。
作者的说明
免责声明
这些信息和出版物并非旨在提供,也不构成TradingView提供或认可的任何形式的财务、投资、交易或其他类型的建议或推荐。请阅读使用条款了解更多信息。