OPEN-SOURCE SCRIPT
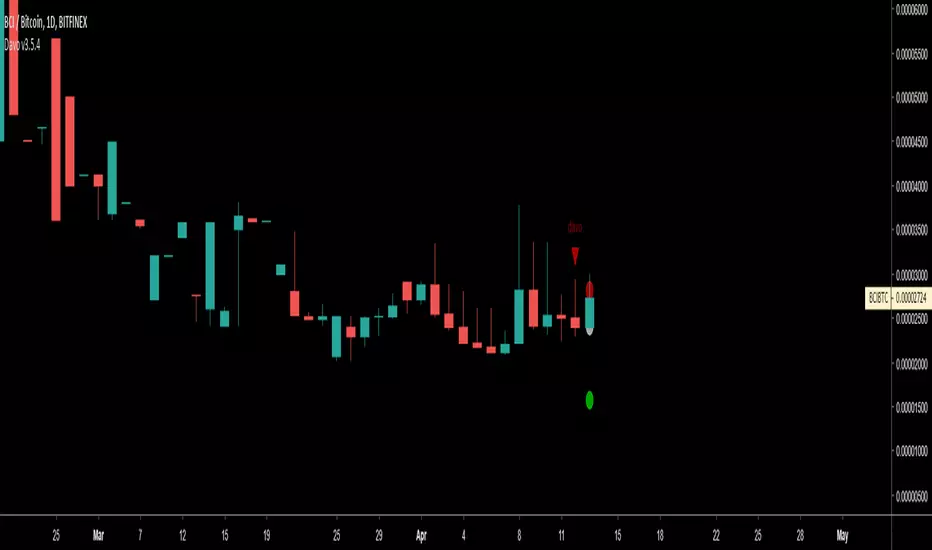
已更新 Dav-o meter (public)

I decided to make this formerly invite only script public (you can find the invite only version here 
If you are part of the invite only you don't need to change scripts. I will push improvements first on the invite only script but in time it will come to this version as well.
I would love to know your ideas and thoughts on how this indicator can be improved, so feel free to give any feedback.
Remember to give it a thumbs up if you like it.
版本注释
- Fixed a bug in RSI (thank you Benjamin!)
- Added a list of future improvements
版本注释
Migrated to Pine Version 3 and added source as an input.版本注释
Pseudo codeExample
General info and acknowledgements
Author: maqpie
Date of publishing: 20th of july 2017
This script is based upon Davinci's davo meter and his original script, which searches for W's and M's in price, OBV, and Willy.
Although the original script is elegant, a W or M has to occur within 5 bars.
This script has removed those limitations.
It took me several different approaches to find a good solution. For the most part because of the lack of any real debugging tool in Pine script.
Let me know what you think, because I feel like I need tone down the number of options so it is easier to use.
If you have any questions, or things you would like to see different please contact me at TRI.
Have fun playing and goofing around with it!
How it works
Now, trading is more of an art form than a science and this indicator is no exception.
When talking about M's and W's, it begs the question: what exactly counts as a W or M?
My personal experience is that for a W to count as such, it has to adhere to the following rules:
1. A 'W' has 5 points, A, B, C, D and E E
2. Point A can be any point C /
3. Point B should be lower than A A / \ /
4. Point C should be higher than B \ / D
5. Point D should be lower than C, but higher than B B
6. Point E should be higher than C
1. A 'M' has 5 points, A, B, C, D and E B
2. Point A can be any point / \ D
3. Point B should be higher than A A \ / \
4. Point C should be lower than B C \
5. Point D should be higher than C, but lower than B E
6. Point E should be lower than C
Script input parameters
You can use the following indicators to search for W's or M's:
- price (close)
- OBV
- Willy
- RSI
- MFI
For each of these indicators you set the following options:
- Use: whether you want to use it
- The maximum width: over how many bars a W / M is allowed to form
- The maximum offset: how many bars back a W / M is allowed to form
- Strict: when not set, rule 5 (see 'How it works') changes: point D no longer has to be above B (for W), and no longer has to be below B (for M)
- Length: length of the indicator, for example a 14 bar RSI
Other options:
- Period: you can limit the period for backtesting. Useful to identify under what market conditions the script works best.
版本注释
v3.4- added MFI
- fixed the offset; the offset wasn't working as intended
- tidied up code
- set the default period for "limit period" to 1/7/2017 - 1/1/2019
v3.5
- added DMI (only DI+ and DI-; ADX is not used)
版本注释
Released 3.5 to quickly; fixed a bug with the DMI. All good now.版本注释
Provided better chart with all the possible indicators on it.版本注释
v3.5.2- Fixed the alert bug which I thought had been fixed in 3.5.1, please use the settings as displayed here: https://imgur.com/a/1rSty7o (I've tested these extensively)
- Changed the clunky 'limit period' option from two dates to a simple past n years
- Renamed 'davo short' and 'davo long' plot text into simply 'davo'
版本注释
v3.5.2- added entry, stop loss and target (use style options to hide them as desired)
版本注释
- Added dynamic RLZ
- Fixed alert condition
版本注释
Updated to version 5 of Pine版本注释
Changed label text color开源脚本
In true TradingView spirit, the creator of this script has made it open-source, so that traders can review and verify its functionality. Kudos to the author! While you can use it for free, remember that republishing the code is subject to our House Rules.
免责声明
The information and publications are not meant to be, and do not constitute, financial, investment, trading, or other types of advice or recommendations supplied or endorsed by TradingView. Read more in the Terms of Use.
开源脚本
In true TradingView spirit, the creator of this script has made it open-source, so that traders can review and verify its functionality. Kudos to the author! While you can use it for free, remember that republishing the code is subject to our House Rules.
免责声明
The information and publications are not meant to be, and do not constitute, financial, investment, trading, or other types of advice or recommendations supplied or endorsed by TradingView. Read more in the Terms of Use.