OPEN-SOURCE SCRIPT
High/Low X Bars Ago
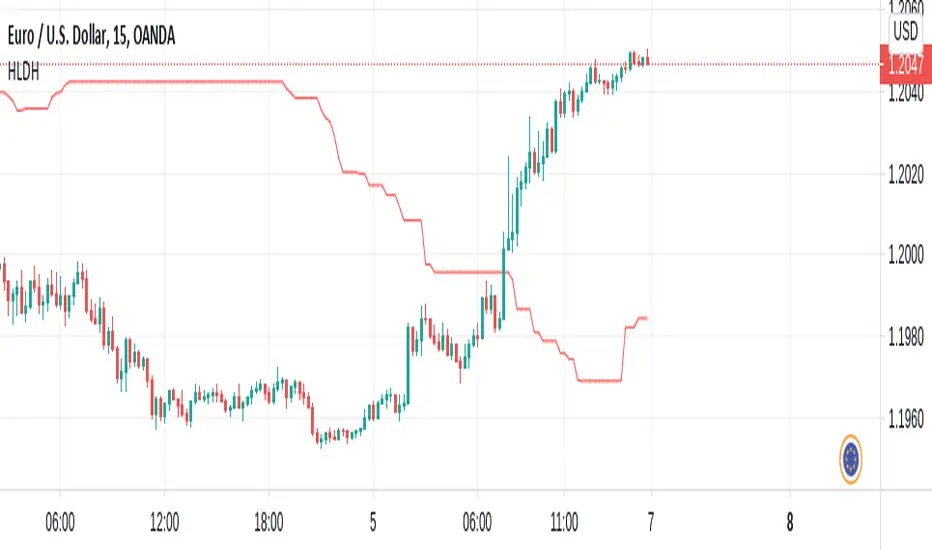
This indicator will plot a line on your chart that shows the highest high point between two previous points on the chart. It does this by reporting the highest point of X number of candles, and begins the look-back X number of candles ago.
Default candle group size is 50, and default look-back begins 50 candles back.
With these settings, the script will essentially plot the highest high point between the candle that printed 100 candles ago, and the candle that printed 50 candles ago.
Options are available for looking for the highest point, or lowest point, with configurable distances in the look-back and candle group ranges.
This script was custom built by Pine-Labs for a user who requested it.
开源脚本
秉承TradingView的精神,该脚本的作者将其开源,以便交易者可以查看和验证其功能。向作者致敬!您可以免费使用该脚本,但请记住,重新发布代码须遵守我们的网站规则。
免责声明
这些信息和出版物并非旨在提供,也不构成TradingView提供或认可的任何形式的财务、投资、交易或其他类型的建议或推荐。请阅读使用条款了解更多信息。
免责声明
这些信息和出版物并非旨在提供,也不构成TradingView提供或认可的任何形式的财务、投资、交易或其他类型的建议或推荐。请阅读使用条款了解更多信息。