OPEN-SOURCE SCRIPT
已更新 Buy and Sell Signals Based on SMI {K28}
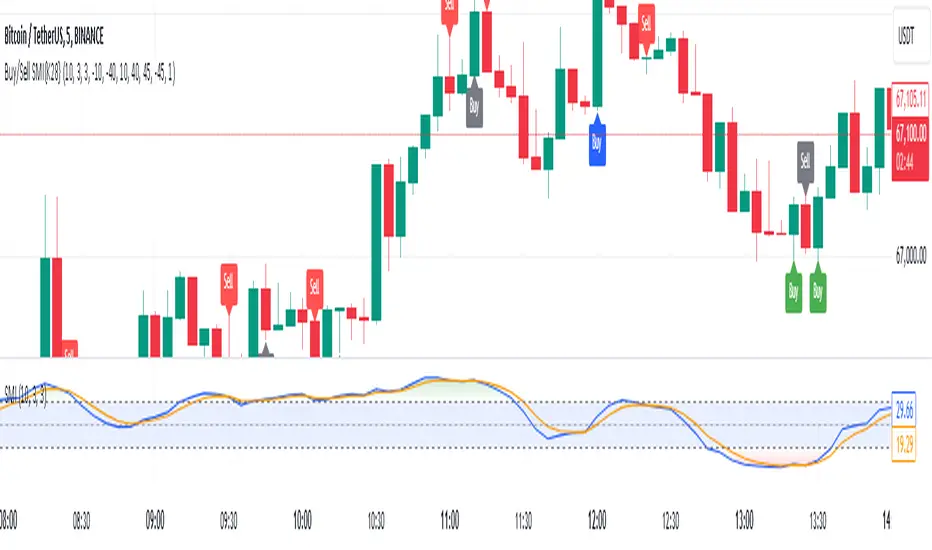
Buy/Sell Signals Based on SMI
This indicator provides buy and sell signals based on the Stochastic Momentum Index (SMI) to assist traders in identifying potential entry and exit points in the market. Here’s how to effectively use this indicator:
Usage Instructions:
Signal Interpretation:
No signal is 100% guaranteed
Green Labels: Indicate strong buy signals when the SMI crosses above its EMA, especially if the candle is green (closing price higher than opening price).
Red Labels: Indicate strong sell signals when the SMI crosses below its EMA.
Cautious Signals:
Blue Buy Labels: These buy signals appear when the SMI is in a cautious zone (between -20 and 20). They may not be as reliable, so confirm these signals with other indicators before acting.
Yellow Sell Labels: These buy signals appear when the SMI is in a cautious zone (between -20 and 20). They may not be as reliable, so confirm these signals with other indicators before acting.
Gray Buy and Sell Labels: Indicate potential false signals (when the SMI is overbought or oversold). Use other confirmation indicators to verify these signals.
Trade Strategy:
This indicator is designed for traders looking to make small, consistent profits. Focus on executing more trades rather than waiting for larger price movements.
Be mindful that the indicator may yield frequent signals, so it's essential to maintain discipline and only take trades that meet your criteria for confirmation.
Important Notes:
Caution with Signals: Always exercise caution when acting on blue or gray labels. These may indicate less reliable signals, so it's crucial to confirm with additional indicators.
No Perfect Indicator: Please remember that no trading indicator is perfect. Use this indicator at your own risk, and consider incorporating risk management strategies into your trading plan.
Conclusion:
By employing this SMI indicator, you can enhance your trading strategy focused on generating small, consistent profits through frequent trades. However, always verify signals and stay aware of market conditions to optimize your trading performance.
版本注释
Additional NoteThis indicator is most effective in trending stocks, where clear uptrends or downtrends are present. It may produce false signals in sideways or range-bound markets, so be cautious and look for strong directional movement to increase the accuracy of signals.
版本注释
Few fixes开源脚本
秉承TradingView的精神,该脚本的作者将其开源,以便交易者可以查看和验证其功能。向作者致敬!您可以免费使用该脚本,但请记住,重新发布代码须遵守我们的网站规则。
免责声明
这些信息和出版物并非旨在提供,也不构成TradingView提供或认可的任何形式的财务、投资、交易或其他类型的建议或推荐。请阅读使用条款了解更多信息。
开源脚本
秉承TradingView的精神,该脚本的作者将其开源,以便交易者可以查看和验证其功能。向作者致敬!您可以免费使用该脚本,但请记住,重新发布代码须遵守我们的网站规则。
免责声明
这些信息和出版物并非旨在提供,也不构成TradingView提供或认可的任何形式的财务、投资、交易或其他类型的建议或推荐。请阅读使用条款了解更多信息。