INVITE-ONLY SCRIPT
Overbalance
已更新

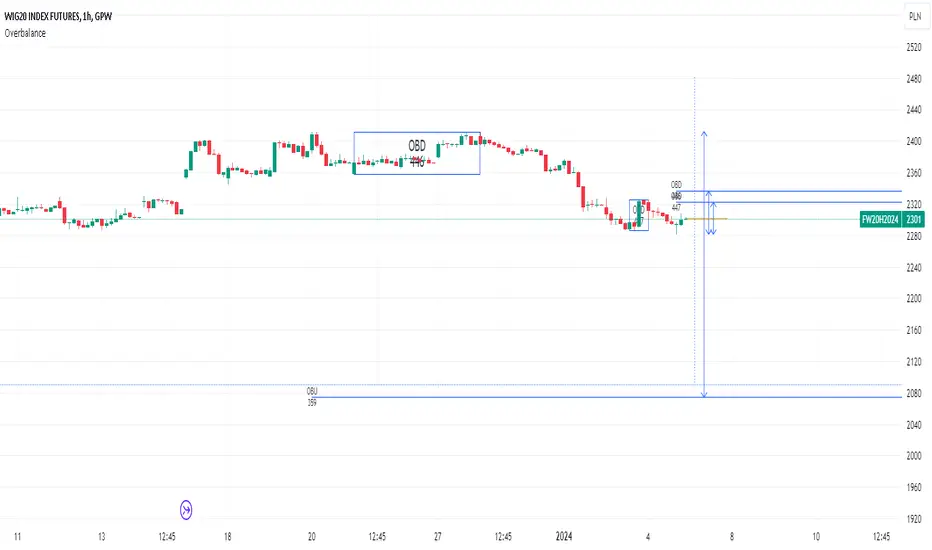
Overbalance script tracks trend moves and biggest corrections in those moves.
Based on last trend extreme value (low or high) it can draw line symbolizing correction equal to
the biggest correction in that trend. It can track up to 20 independent (both up and down) trends on one chart.
Overbalance method works on an assumption that trend continues until we have correction bigger than the biggest existing correction in that trend. Comparing the historically biggest correction with the current one can give a warning signal.
There are markets and instruments for which the size of corrections is repeated, and tracking corrections in the trend can be used to predict the trend change moment. - Just remember that if something happened in the past it is not guaranteed that it will happen again.
This script can be used by ANY user. You DO NOT NEED to have PRO or PREMIUM account to use it.
Script settings:
Trend min change [%] - Filter out price moves smaller than % of current price.
OB up - Showing overbalance in up trends
OB down - Showing overbalance in down trends
Historical with precision [%] - Showing corrections moves that were equal to biggest previous correction in that trend with a given (%) precision.
OB prediction up - Showing overbalance threshold in current up trends
OB prediction down - Showing overbalance threshold in current down trends
OB Exceeded - Showing broken overbalance thresholds
Arrows - Showing overbalance thresholds with an arrows
(with labels) - Showing labels over overbalance threshold arrows
Price line - It draws a line at the price level, under the arrows.
Troubleshooting:
In case of any problems, send error details to the author of the script.
版本注释
Package of improvements and bug fixes:- Table with all trends, overbalance values and fib retracements factors.
- Broken trends are marked in the table with the red background
- New settings section:
Table: Position - Defining place where table will be drawn
Text - Defining table text size
List of fields visible in the table:
From value - Showing price value at the start point of a trend.
From time - Showing for how many days this trend exist.
Fib. retr. max - Showing what was the maximal fibonacci retracement for this trend.
Fib. retr. cur - Showing fibonacci retracement value for the current price.
Fib retr. OB - Showing fibonacci retracement value for overbalance threshold.
Ob. distance - Showing price distance from the overbalance threshold.
Verify Fib retr with inaccuracy ‰ - Feature that is highlighting fibonacci retracement values having value around typical fibonacii value with the provided precision ( in ‰)
仅限邀请脚本
仅限作者授权的用户访问此脚本,并且通常需要付费。您可以将其添加到收藏中,但是只有在向作者请求并获得许可之后,才能使用它。 请联系Investor_R了解更多信息,或按照以下作者的说明操作。
TradingView不建议付费使用脚本,除非您100%信任作者并了解脚本的工作原理。在许多情况下,您可以在我们的社区脚本免费找到不错的开源替代方案。
作者的说明
″To get access or report problem write on toolkit4trading@proton.me
想在图表上使用此脚本?
警告:请在申请访问权限之前阅读。
To get access or report problem write on toolkit4trading@proton.me
More details on Website and Youtube.
More details on Website and Youtube.
免责声明
这些信息和出版物并不意味着也不构成TradingView提供或认可的金融、投资、交易或其它类型的建议或背书。请在使用条款阅读更多信息。