INVITE-ONLY SCRIPT
BLITZ PE ANAYLYZER
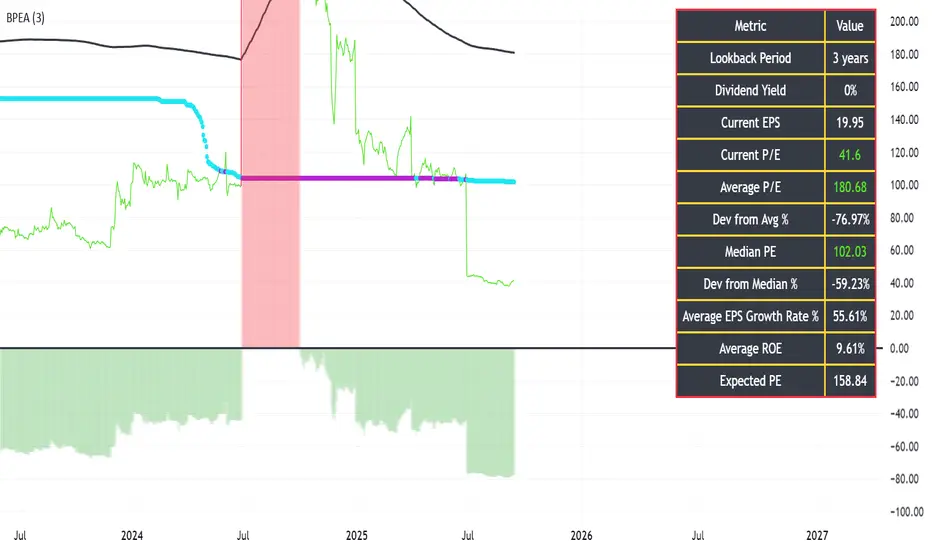
Following script is designed specifically to meet the requirement of accessing the PE ratio, comparing it to it's historical averages, median and expected values that are possible.
Following is the method to use the indicator:
1) User must select the look back years which is by default set to 3 years as per the text book reference from the book "The Intelligent Investor" by Sir Benjamin Graham
2) The red or green histogram represents the deviation of the current PE to the average PE. If the histograms are green in color, it represent buy opportunity because the current PE is lower than that of the average PE values, the % deviation of the current PE from the average value is mentioned in the black color table and a negative value represents under evaluations as compared to the historical PE ratio
3) The black color line is the SMA of the PE ratio.
4) Another plots exists for plotting the current PE which is red or green depending upon its deviation from the average PE values & another plot exists for median PE ratio which is light blue when healthy and purple when not healthy.
5) Using the inflation data and the EPS growth of the company the black table also displays the expected value of the PE ratio for the stock.
仅限邀请脚本
只有作者授权的用户才能访问此脚本。您需要申请并获得使用许可。通常情况下,付款后即可获得许可。更多详情,请按照下方作者的说明操作,或直接联系Noob1003。
TradingView不建议您付费购买或使用任何脚本,除非您完全信任其作者并了解其工作原理。您也可以在我们的社区脚本找到免费的开源替代方案。
作者的说明
This is a paid indicator, useful for all who are into portfolio management & stock picking.
Fees to get the paid subscription of this stock is mere $100/- for lifetime usage.
Payments are accepted in cash, bank transfer, upi, paypal, crypto
免责声明
这些信息和出版物并非旨在提供,也不构成TradingView提供或认可的任何形式的财务、投资、交易或其他类型的建议或推荐。请阅读使用条款了解更多信息。