OPEN-SOURCE SCRIPT
NQ YM Correlation 1 min data
Overview
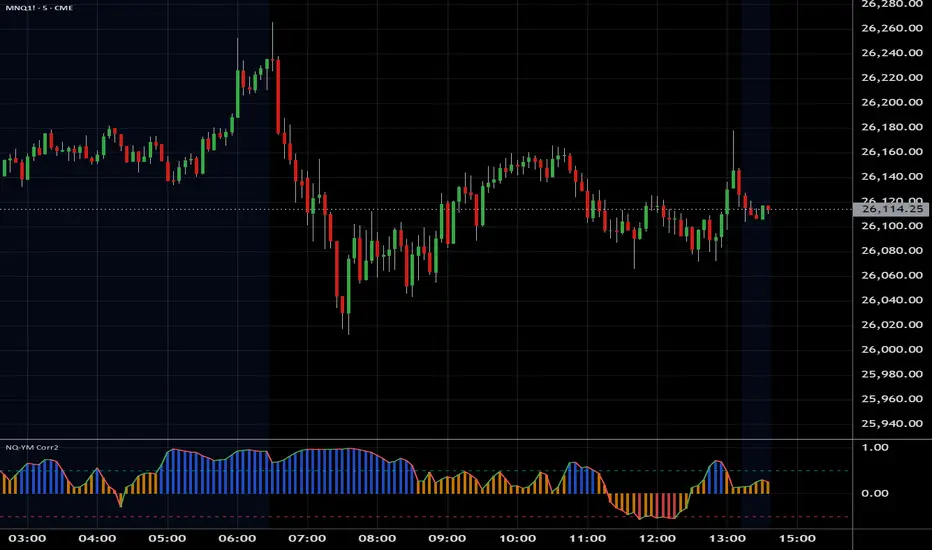
This indicator plots the correlation between Nasdaq 100 (NQ) and Dow Jones (YM) futures. It is specifically designed to act as an "Engine RPM" gauge for pairs traders who trade divergence or spread breakouts—not mean reversion.
To ensure consistent readings, this indicator always calculates using a 1-minute timeframe data, regardless of the chart timeframe you are currently viewing.
The core idea is:
High Correlation (Blue Zone): "Low RPM" or "Engine Idle." NQ and YM are moving together. The spread is flat. This is a no-trade zone.
Low Correlation (Red Zone): "High RPM" or "Engine Hot." NQ and YM are diverging. The spread is moving. This is the primary trade zone.
开源脚本
秉承TradingView的精神,该脚本的作者将其开源,以便交易者可以查看和验证其功能。向作者致敬!您可以免费使用该脚本,但请记住,重新发布代码须遵守我们的网站规则。
免责声明
这些信息和出版物并非旨在提供,也不构成TradingView提供或认可的任何形式的财务、投资、交易或其他类型的建议或推荐。请阅读使用条款了解更多信息。
开源脚本
秉承TradingView的精神,该脚本的作者将其开源,以便交易者可以查看和验证其功能。向作者致敬!您可以免费使用该脚本,但请记住,重新发布代码须遵守我们的网站规则。
免责声明
这些信息和出版物并非旨在提供,也不构成TradingView提供或认可的任何形式的财务、投资、交易或其他类型的建议或推荐。请阅读使用条款了解更多信息。