INVITE-ONLY SCRIPT
DMI‴ | Enhanced Directional Movement Indicator‴
What does it do?
Used for calling your attention to rally price trend with a more suitable color and arrows that allow you to see the delailed movement without needing to zoom the indicator.
How does it work?
Works the exact same way as the ordinary DMI, but with arrows that signals the direction of each DMI line and a right side bar signal for each of these lines, that also provides information over the strength (if a given DMI line is above or under 20% move).
This indicador is used in conjunction with other indicadtor in the BOLLINGER BLAST setup provides a way bigger knowledge of a huge price rally.
What's my filling?
I rather use it with in conjunction with other indicadtor in the BOLLINGER BLAST setup in order to provide me with a way bigger knowledge of a huge price rally.
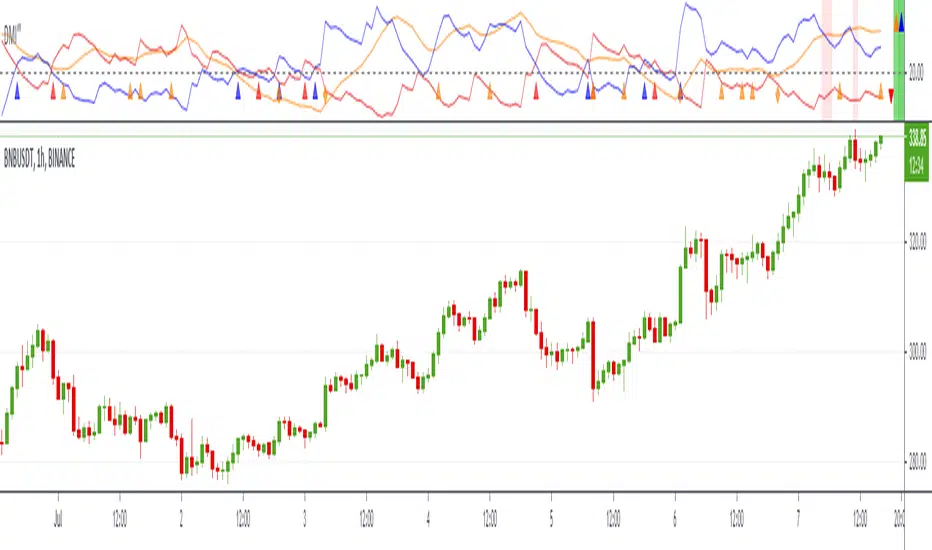
Indicator attributes:
- red line is the DMI Negative line
- blue line is the DMI Positive line
- lines over the 20% scale give more strength to the price movement
- right side bar: signals the suggests which DMI line has more strength
- yellow "diamond" and "triangle" figures signal that the ADX line is moving up
- blue and red "triangle" figure signal that the +DMI or -DMI is crossing over the 20% line
- the light red back ground shade signals that Volatility is activated and that price spread and volume are to be expected
To have access to this indicator, please DM me.
Don't contact me in the comment area.
Used for calling your attention to rally price trend with a more suitable color and arrows that allow you to see the delailed movement without needing to zoom the indicator.
How does it work?
Works the exact same way as the ordinary DMI, but with arrows that signals the direction of each DMI line and a right side bar signal for each of these lines, that also provides information over the strength (if a given DMI line is above or under 20% move).
This indicador is used in conjunction with other indicadtor in the BOLLINGER BLAST setup provides a way bigger knowledge of a huge price rally.
What's my filling?
I rather use it with in conjunction with other indicadtor in the BOLLINGER BLAST setup in order to provide me with a way bigger knowledge of a huge price rally.
Indicator attributes:
- red line is the DMI Negative line
- blue line is the DMI Positive line
- lines over the 20% scale give more strength to the price movement
- right side bar: signals the suggests which DMI line has more strength
- yellow "diamond" and "triangle" figures signal that the ADX line is moving up
- blue and red "triangle" figure signal that the +DMI or -DMI is crossing over the 20% line
- the light red back ground shade signals that Volatility is activated and that price spread and volume are to be expected
To have access to this indicator, please DM me.
Don't contact me in the comment area.
仅限邀请脚本
只有作者授权的用户才能访问此脚本。您需要申请并获得使用许可。通常情况下,付款后即可获得许可。更多详情,请按照下方作者的说明操作,或直接联系MarceloTorres。
TradingView不建议您付费购买或使用任何脚本,除非您完全信任其作者并了解其工作原理。您也可以在我们的社区脚本找到免费的开源替代方案。
作者的说明
To have access to this indicator, please DM me.
Don't contact me in the comment area.
TRADEWISER | Marcelo Torres
marcelo@tradewiser.pro
Vídeo-Análise completa diária no YouTube:
youtube.com/c/TradeWiserPro
Curso/AE
CursoAE.TradeWiser.pro
@TradeWiserPro
Telegram, Twitter, Facebook, LinkedIn, Instagram
marcelo@tradewiser.pro
Vídeo-Análise completa diária no YouTube:
youtube.com/c/TradeWiserPro
Curso/AE
CursoAE.TradeWiser.pro
@TradeWiserPro
Telegram, Twitter, Facebook, LinkedIn, Instagram
免责声明
这些信息和出版物并非旨在提供,也不构成TradingView提供或认可的任何形式的财务、投资、交易或其他类型的建议或推荐。请阅读使用条款了解更多信息。