INVITE-ONLY SCRIPT
已更新 MFR Range
Hello Traders!
You requested it for many months, we are finally making our proprietary Range available to all.
First of all, how should a trader consider a Range in general:
In trading, a "range" refers to a specific price interval or zone within which an asset's price moves or consolidates for a period of time. Ranges are characterized by relatively horizontal or sideways price movements, where the price oscillates between a defined upper and lower boundary. Traders often use ranges to identify potential trading opportunities, manage risk, and make trading decisions.
Here's how ranges are used in trading:
1. Range Identification:
Traders identify ranges by observing price charts and looking for periods where the price appears to be moving horizontally with clear upper and lower boundaries.
Common range patterns include rectangles, channels, and horizontal consolidations.
2. Range Trading Strategies:
Range trading strategies aim to profit from price movements within the established range. Traders typically use two main approaches within a range:
Buying near the range's lower boundary: Traders buy when the price approaches the lower end of the range, anticipating a bounce or reversal towards the upper boundary. This is often referred to as "buying support."
Selling near the range's upper boundary: Traders sell when the price approaches the upper end of the range, anticipating a pullback or reversal towards the lower boundary. This is known as "selling resistance."
3. Risk Management:
Stop-loss orders are crucial when trading ranges. Traders set stop-loss orders just outside the range's boundaries to limit potential losses if the price breaks out of the range unpredictably.
4. Range Breakouts:
Ranges do not last indefinitely, and eventually, the price may break out of the range, leading to a significant price movement.
Traders often look for breakout patterns and use breakout trading strategies to capitalize on the potential for a strong price movement after the range is broken.
5. Volatility Consideration:
Some traders may assess the volatility within the range. If the price oscillates within the range with high volatility, they may consider trading shorter timeframes for smaller, quicker profits.
Lower volatility may prompt longer-term traders to take positions within the range, expecting a slower, more controlled price movement.
6. Time Frame Analysis:
Traders may analyze the time frame in which the range has developed, in our case MFR range are based solely on the Daily timeframe.
7. Confirmation Indicators:
Traders often use technical indicators like Relative Strength Index (RSI), Moving Averages, or Bollinger Bands to confirm range trading signals and assess overbought or oversold conditions.
8. Range Boundaries as Support and Resistance:
Once a range is identified, its upper and lower boundaries can serve as key support and resistance levels even after the range is broken. Traders pay attention to these levels for future trading decisions.
9. Range Expansion:
Some traders look for signs of range expansion, where the price starts to break out or trend strongly. This can signal the end of a range-bound market and a transition to a trending market.
It's important to note that while range trading can be profitable, it requires careful analysis and risk management. Traders must be prepared for the possibility of a breakout that can result in significant losses if they are on the wrong side of the trade. Additionally, market conditions can change, and ranges can evolve into trends or other patterns, so traders need to adapt their strategies accordingly.
What is specific to MFR range?
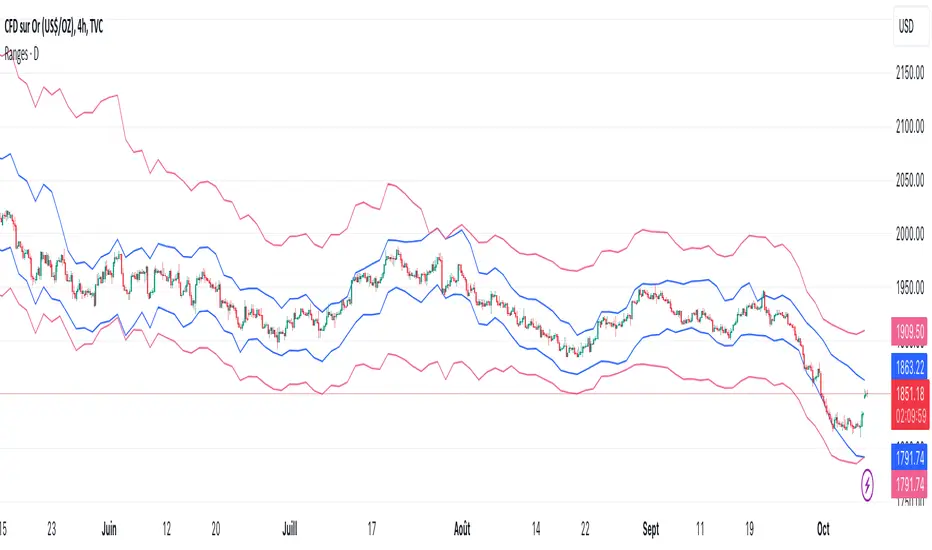
This script calculates and plots a trading range on a daily timeframe based on historical price data. Based on Benoit Mandelbrot and Edgar E. Peters publications on Range, we run a set of calculations over a defined period. The script will define those to generate the "Range High" and "Range Low". These values are used to define the upper and lower bounds of the trading range.
In short, how could I use this script?
A trader could use the Range to find overbought or oversold points to enter a position. The Lower Range being the price to buy an asset and the Upper Range being the place to sell an asset. This is recommended to be implemented only when our other indication called Trend matches the strategy: buy when the trend is bullish or short when the trend is bearish.
It's important to note that while Range is a useful tool, it should not be relied upon solely for making trading decisions. It's recommended to use it in conjunction with other technical analysis tools and consider other factors such as market conditions, risk management, and fundamental analysis. Remember that the Range indicator is just one tool among many, and it's important to consider other factors such as volume, momentum, volatility, and overall market conditions when making trading decisions. Additionally, using stop-loss orders and proper risk management techniques is crucial to mitigate potential losses.
We hope that you will find these explanations useful, please contact us by private message for access.
Enjoy!
DISCLAIMER: No sharing, copying, reselling, modifying, or any other forms of use are authorised. This script is strictly for individual use and educational purposes only. This is not financial or investment advice. Investments are always made at your own risk and are based on your personal judgement. Myfractalrange is not responsible for any losses you may incur. Please invest wisely.
You requested it for many months, we are finally making our proprietary Range available to all.
First of all, how should a trader consider a Range in general:
In trading, a "range" refers to a specific price interval or zone within which an asset's price moves or consolidates for a period of time. Ranges are characterized by relatively horizontal or sideways price movements, where the price oscillates between a defined upper and lower boundary. Traders often use ranges to identify potential trading opportunities, manage risk, and make trading decisions.
Here's how ranges are used in trading:
1. Range Identification:
Traders identify ranges by observing price charts and looking for periods where the price appears to be moving horizontally with clear upper and lower boundaries.
Common range patterns include rectangles, channels, and horizontal consolidations.
2. Range Trading Strategies:
Range trading strategies aim to profit from price movements within the established range. Traders typically use two main approaches within a range:
Buying near the range's lower boundary: Traders buy when the price approaches the lower end of the range, anticipating a bounce or reversal towards the upper boundary. This is often referred to as "buying support."
Selling near the range's upper boundary: Traders sell when the price approaches the upper end of the range, anticipating a pullback or reversal towards the lower boundary. This is known as "selling resistance."
3. Risk Management:
Stop-loss orders are crucial when trading ranges. Traders set stop-loss orders just outside the range's boundaries to limit potential losses if the price breaks out of the range unpredictably.
4. Range Breakouts:
Ranges do not last indefinitely, and eventually, the price may break out of the range, leading to a significant price movement.
Traders often look for breakout patterns and use breakout trading strategies to capitalize on the potential for a strong price movement after the range is broken.
5. Volatility Consideration:
Some traders may assess the volatility within the range. If the price oscillates within the range with high volatility, they may consider trading shorter timeframes for smaller, quicker profits.
Lower volatility may prompt longer-term traders to take positions within the range, expecting a slower, more controlled price movement.
6. Time Frame Analysis:
Traders may analyze the time frame in which the range has developed, in our case MFR range are based solely on the Daily timeframe.
7. Confirmation Indicators:
Traders often use technical indicators like Relative Strength Index (RSI), Moving Averages, or Bollinger Bands to confirm range trading signals and assess overbought or oversold conditions.
8. Range Boundaries as Support and Resistance:
Once a range is identified, its upper and lower boundaries can serve as key support and resistance levels even after the range is broken. Traders pay attention to these levels for future trading decisions.
9. Range Expansion:
Some traders look for signs of range expansion, where the price starts to break out or trend strongly. This can signal the end of a range-bound market and a transition to a trending market.
It's important to note that while range trading can be profitable, it requires careful analysis and risk management. Traders must be prepared for the possibility of a breakout that can result in significant losses if they are on the wrong side of the trade. Additionally, market conditions can change, and ranges can evolve into trends or other patterns, so traders need to adapt their strategies accordingly.
What is specific to MFR range?
This script calculates and plots a trading range on a daily timeframe based on historical price data. Based on Benoit Mandelbrot and Edgar E. Peters publications on Range, we run a set of calculations over a defined period. The script will define those to generate the "Range High" and "Range Low". These values are used to define the upper and lower bounds of the trading range.
In short, how could I use this script?
A trader could use the Range to find overbought or oversold points to enter a position. The Lower Range being the price to buy an asset and the Upper Range being the place to sell an asset. This is recommended to be implemented only when our other indication called Trend matches the strategy: buy when the trend is bullish or short when the trend is bearish.
It's important to note that while Range is a useful tool, it should not be relied upon solely for making trading decisions. It's recommended to use it in conjunction with other technical analysis tools and consider other factors such as market conditions, risk management, and fundamental analysis. Remember that the Range indicator is just one tool among many, and it's important to consider other factors such as volume, momentum, volatility, and overall market conditions when making trading decisions. Additionally, using stop-loss orders and proper risk management techniques is crucial to mitigate potential losses.
We hope that you will find these explanations useful, please contact us by private message for access.
Enjoy!
DISCLAIMER: No sharing, copying, reselling, modifying, or any other forms of use are authorised. This script is strictly for individual use and educational purposes only. This is not financial or investment advice. Investments are always made at your own risk and are based on your personal judgement. Myfractalrange is not responsible for any losses you may incur. Please invest wisely.
版本注释
Fixed a graphic issue版本注释
We added our Longer-Term Range to the script.Users can now display Range and LT Range to monitor the excess Upside and Downside
仅限邀请脚本
只有作者授权的用户才能访问此脚本。您需要申请并获得使用许可。通常情况下,付款后即可获得许可。更多详情,请按照下方作者的说明操作,或直接联系myfractalrange。
TradingView不建议您付费购买或使用任何脚本,除非您完全信任其作者并了解其工作原理。您也可以在我们的社区脚本找到免费的开源替代方案。
作者的说明
To request access to this script, contact us directly by private message
Manage your portfolio using a Trend based system | Trial plans available on myfractalrange.com| ETFs, stocks, bonds, cryptos
免责声明
这些信息和出版物并非旨在提供,也不构成TradingView提供或认可的任何形式的财务、投资、交易或其他类型的建议或推荐。请阅读使用条款了解更多信息。