PROTECTED SOURCE SCRIPT
Dynamic Probability Bands (Historical Bands)
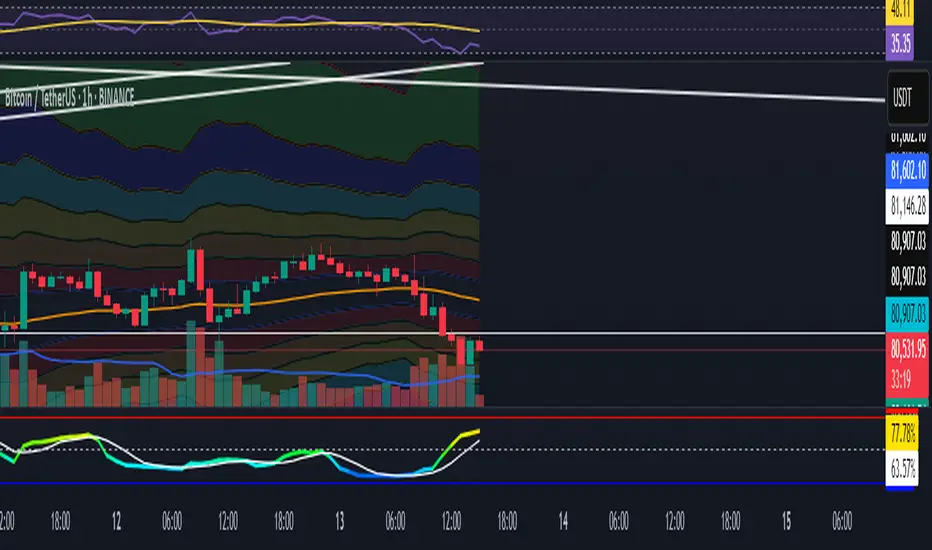
Dynamic Probability Bands (Blended/Original Modes)
This indicator displays dynamic probability bands that estimate the likelihood (on a 0–100 scale) for a stock to move within certain price zones relative to a dynamically calculated center. It combines state‐of‐the‐art volatility scaling with customizable center calculation methods, allowing traders to analyze both current and historical price probability levels.
Key Features:
Dual Center Modes:
Original Mode: Uses either an EMA or yesterday’s pivot (average of high, low, and close) as the center.
Blended Mode: Inspired by HPDR Bands, it calculates the center by blending a long-term “visible” range (expanded by custom multipliers) with recent price extremes. This blending makes the center both robust and responsive.
Volatility Scaling with Exponential Factor: The script measures volatility using ATR and expands the forecast range over a user-defined number of bars. An exponent factor lets you adjust the dynamic expansion—from the familiar square-root behavior (with a factor of 0.5) to more aggressive widening.
Probability Levels via Inverse Normal Function: Custom inverse error and inverse-normal functions convert cumulative probability inputs (ranging from near 0% to almost 100%) into z-scores. The resulting band levels are computed as: Band Level = Center + (Scaled Volatility × z-score) Separate series are generated for upward (above the center) and downward (below the center) bands.
Historical Analysis & Visualization: The bands are plotted as continuous series, with fill colors between adjacent bands for clear visual separation. This lets you analyze how the probability zones have evolved over time.
Fully Customizable: Users can adjust key parameters including the choice of center method, lookback periods, multipliers, forecast horizon, and expansion dynamics to suit various markets and strategies.
Use This Indicator To:
Assess potential future price zones based on statistical probability.
Monitor the dynamic evolution of price ranges as market conditions change.
Customize your analysis through blended or traditional center calculations and variable volatility scaling.
受保护脚本
此脚本以闭源形式发布。 但是,您可以自由使用,没有任何限制 — 了解更多信息这里。
免责声明
这些信息和出版物并非旨在提供,也不构成TradingView提供或认可的任何形式的财务、投资、交易或其他类型的建议或推荐。请阅读使用条款了解更多信息。
免责声明
这些信息和出版物并非旨在提供,也不构成TradingView提供或认可的任何形式的财务、投资、交易或其他类型的建议或推荐。请阅读使用条款了解更多信息。