INVITE-ONLY SCRIPT
已更新 Liquidity Raids and Sweeps by Texmoonbeam
Liquidity is a vital concept in trading. It gives us an indication of where buy / sell orders are in the market, and the direction price is likely to move once this liquidity has been taken.
The purpose of this indicator is to show you when and where there has been a 'raid' or 'sweep' of this liquidity, meaning a reversal might occur.
The indicator does this by looking for candle wicks, that go beyond a previous pivot high or low.
Settings:
Timeframe – This settings changes the timeframe that the indicator looks for raids/sweeps. Higher timeframes generally mean stronger moves.
Left bars – the number of bars gap higher/lower to the left of a pivot low/high. A higher number means the high or low was formed from a stronger move.
Right bars – the number of bars gap higher/lower to the right of a pivot low/high. A higher number means the high or low started a stronger move.
Max Gap – the maximum number of candles between a raid or sweep. Reduce this number on higher time frames if there are memory errors.
Min Gap – the minimum number of candles between a raid or sweep.
Alerts Wait For Close – If ticked, this means an alert will not be triggered by the current candle wick, overlapping a previous, until the close of that candle. Unticked you will be alerted as soon as the current candle crosses a previous high/low, though it might close far beyond that point and not actually turn out to be a raid/sweep.
Buy Side/Sell Side – line style and colour preferences for buy and sell side.
Strategy:
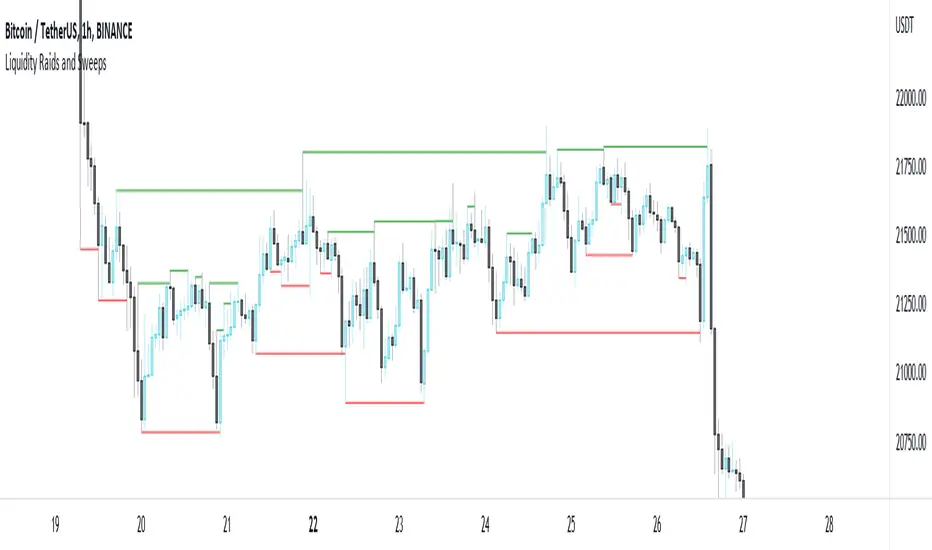
As seen in the example chart, the raid/sweep of liquidity, where only a wick reaches beyond a previous high or low, can be followed by a reversal of direction, often to seek other liquidity targets. This indicator could provide an opportunity to enter a trade at this point and the alert feature means you will be able to set up custom alerts on multiple charts or timeframes.
You should use other confluence and a lower time frame confirmation after a raid/sweep, to identify your entry, stop loss and targets. Familiarity with liquidity and smart money concepts are recommended.
The purpose of this indicator is to show you when and where there has been a 'raid' or 'sweep' of this liquidity, meaning a reversal might occur.
The indicator does this by looking for candle wicks, that go beyond a previous pivot high or low.
Settings:
Timeframe – This settings changes the timeframe that the indicator looks for raids/sweeps. Higher timeframes generally mean stronger moves.
Left bars – the number of bars gap higher/lower to the left of a pivot low/high. A higher number means the high or low was formed from a stronger move.
Right bars – the number of bars gap higher/lower to the right of a pivot low/high. A higher number means the high or low started a stronger move.
Max Gap – the maximum number of candles between a raid or sweep. Reduce this number on higher time frames if there are memory errors.
Min Gap – the minimum number of candles between a raid or sweep.
Alerts Wait For Close – If ticked, this means an alert will not be triggered by the current candle wick, overlapping a previous, until the close of that candle. Unticked you will be alerted as soon as the current candle crosses a previous high/low, though it might close far beyond that point and not actually turn out to be a raid/sweep.
Buy Side/Sell Side – line style and colour preferences for buy and sell side.
Strategy:
As seen in the example chart, the raid/sweep of liquidity, where only a wick reaches beyond a previous high or low, can be followed by a reversal of direction, often to seek other liquidity targets. This indicator could provide an opportunity to enter a trade at this point and the alert feature means you will be able to set up custom alerts on multiple charts or timeframes.
You should use other confluence and a lower time frame confirmation after a raid/sweep, to identify your entry, stop loss and targets. Familiarity with liquidity and smart money concepts are recommended.
版本注释
Added support for custom time frames, such as 2m, 10m, 6h, etc.Fixed a bug in the drawing of lines when time frame was set to 'Chart'.
版本注释
Introduced a maximum gap between raids of 60 bars. This fixes the replay mode feature, which was not working when viewing low time frames, with higher time frame raids shown.You can now, for example, view raids of the 1 hour time frame, change your chart to m5 and use replay mode to find your entries.
If you want to find raids over a gap larger than 60 bars, you would just use a higher time frame. So a 60 bar gap on 1 hour only requires a 30 bar gap on 2 hour.
版本注释
Changed a few default settings and added a few tooltips仅限邀请脚本
只有作者授权的用户才能访问此脚本。您需要申请并获得使用许可。通常情况下,付款后即可获得许可。更多详情,请按照下方作者的说明操作,或直接联系Texmoonbeam。
TradingView不建议您付费购买或使用任何脚本,除非您完全信任其作者并了解其工作原理。您也可以在我们的社区脚本找到免费的开源替代方案。
作者的说明
Please direct message me on TradingView or Twitter to request trial access
https://twitter.com/texmoonbeam
A downloadable PDF guide can be found here
https://drive.google.com/file/d/10Dcxo20-mrJHeESCXT6SllayQRgSnxtp/view?usp=sharing
Contact me directly on TradingView or Twitter for queries, for purchasing and indicator guides please check here texmoonbeam.notion.site/TradingView-Indicators-by-Texmoonbeam-9f09de3020864ff6a786004af3ba2488
免责声明
这些信息和出版物并非旨在提供,也不构成TradingView提供或认可的任何形式的财务、投资、交易或其他类型的建议或推荐。请阅读使用条款了解更多信息。
仅限邀请脚本
只有作者授权的用户才能访问此脚本。您需要申请并获得使用许可。通常情况下,付款后即可获得许可。更多详情,请按照下方作者的说明操作,或直接联系Texmoonbeam。
TradingView不建议您付费购买或使用任何脚本,除非您完全信任其作者并了解其工作原理。您也可以在我们的社区脚本找到免费的开源替代方案。
作者的说明
Please direct message me on TradingView or Twitter to request trial access
https://twitter.com/texmoonbeam
A downloadable PDF guide can be found here
https://drive.google.com/file/d/10Dcxo20-mrJHeESCXT6SllayQRgSnxtp/view?usp=sharing
Contact me directly on TradingView or Twitter for queries, for purchasing and indicator guides please check here texmoonbeam.notion.site/TradingView-Indicators-by-Texmoonbeam-9f09de3020864ff6a786004af3ba2488
免责声明
这些信息和出版物并非旨在提供,也不构成TradingView提供或认可的任何形式的财务、投资、交易或其他类型的建议或推荐。请阅读使用条款了解更多信息。