INVITE-ONLY SCRIPT
Bidirectional MoM w/ Time Weighting | Optional Intrabar Data

Bidirectional MoM w/ Time Weighting | Optional Intrabar Data
Core Components:
Intrabar Data Extraction:
The script optionally harnesses lower time frame data (e.g., per-second intervals) for high and low prices within each primary bar. You can set it to the current chart time but if you want to use intrabar data it uses the request.security_lower_tf() to properly pull intrabar data.
This fine-grained data enables an in-depth examination of the price action that occurs within a standard timeframe, enhancing the ability to detect subtle market movements.
A key threshold based on Average True Range (ATR) is used to measure significant price changes intrabar, adding a robust filter for volatility sensitivity.
Cumulative Time-to-Threshold Analysis:
The indicator tracks how long it takes for price changes to reach specified thresholds, marking critical time points when upward or downward price movements exceed these levels. This approach provides insights into the speed and intensity of directional shifts within the market.
The calculated time-to-threshold values act as temporal markers that influence subsequent momentum weighting.
Bidirectional Momentum Calculation:
Momentum is assessed in two directions (upward and downward) using a comprehensive array of price changes.
Adaptive Weighting Mechanism:
Each momentum value is weighted by the calculated time-to-threshold, giving preference to momentum that occurs more rapidly and aligning with potential breakout conditions.
The script also factors in correlations between momentum and price change, ensuring that only the most relevant signals contribute to the final analysis.
Iterative Length Analysis:
By iterating over a range of lengths (e.g., 100 to 200 periods), the script aggregates data to assess momentum across different time scales. This provides a more holistic view of market behavior, accommodating both short-term fluctuations and longer-term trends.
Each length is evaluated using moving averages and correlations to determine its contribution to the total weighted momentum.
Final Aggregated Output:
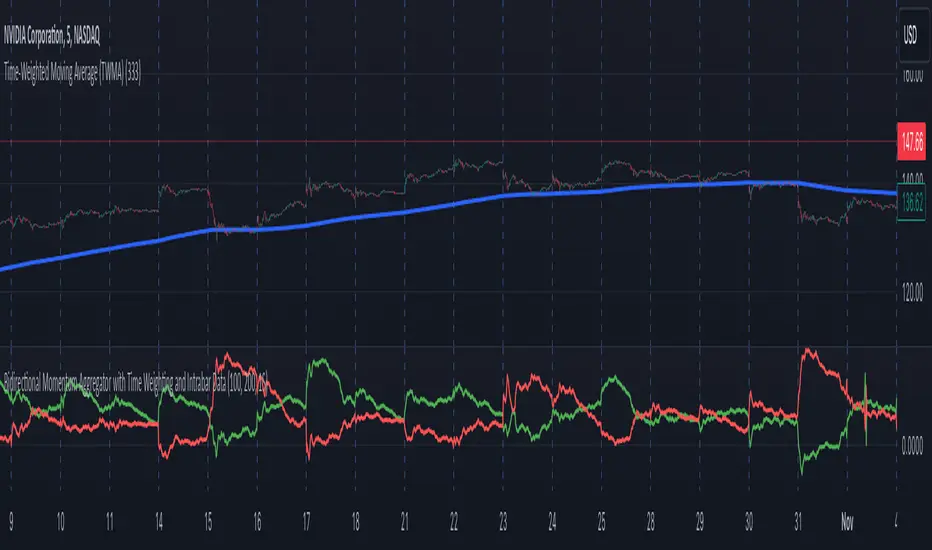
The weighted sums of upward and downward momentum are normalized by the total weight to produce a final composite metric.
The indicator plots these results as separate upward and downward momentum lines, offering traders a visual representation of which direction holds more momentum strength over various intervals.
Practical Application:
This indicator's advanced design is tailored for traders who require a deeper understanding of price movement dynamics and the underlying forces driving market momentum. By incorporating intrabar data, adaptive time-to-threshold calculations, and iterative analysis, this tool seeks to provide a clearer view of potential market direction shifts and their timing.
The indicator can be used to:
Identify potential breakout or reversal points by observing significant shifts in weighted momentum.
Gauge the relative strength of uptrends and downtrends through the plotted momentum lines.
Enhance decision-making with an additional layer of granularity from intrabar data.
In essence, this script is an ambitious attempt to blend multi-scale analysis, momentum dynamics, and time-weighted evaluation, creating a unique approach to understanding market behavior beyond conventional indicators.
仅限邀请脚本
仅限作者授权的用户访问此脚本,并且通常需要付费。您可以将其添加到收藏中,但是只有在向作者请求并获得许可之后,才能使用它。 请联系Cmo22了解更多信息,或按照以下作者的说明操作。
TradingView不建议付费使用脚本,除非您100%信任作者并了解脚本的工作原理。在许多情况下,您可以在我们的社区脚本免费找到不错的开源替代方案。
作者的说明
″The indicator tracks how long it takes for price changes to reach specified thresholds, marking critical time points when upward or downward price movements exceed these levels. This approach provides insights into the speed and intensity of directional s
想在图表上使用此脚本?
警告:请在申请访问权限之前阅读。
免责声明
这些信息和出版物并不意味着也不构成TradingView提供或认可的金融、投资、交易或其它类型的建议或背书。请在使用条款阅读更多信息。